Master 10 Years of Annual Reports With the WorkBuddy Expert Team: A Reusable Listed-Company Deep-Research Method
Scene Description
When business analysts (MBA students, consultants, industry researchers, investment & strategy roles) face an unfamiliar listed company, the core problem isn't "lack of info" — it's how to build a complete, credible, verifiable understanding of the company in a short time. The most authoritative and complete public material is the annual report; one report runs 200–300 pages, and ten years means thousands of pages. Manually reading and cross-checking narrative definitions against financial data usually takes weeks, and year-by-year comparability and consistent definitions are hard.
This case's value isn't the "digital-transformation analysis report" deliverable itself — it's that it fully demonstrates a general "listed-company deep-research" methodology: first-hand sources as the base, text + data dual-line cross-validation, a theoretical framework as the analysis skeleton, and a fully reproducible pipeline — handed to WorkBuddy's "Smart-Data Analysis Expert Team" (Agent Swarm multi-agent team) in one pass: download ten years of annual reports from cninfo, parse PDFs, do text semantic analysis, financial quantification, theory integration and chart making, then assemble a final HTML consulting report — all auto, with all intermediate computation saved as reproducible Python scripts.
The analysis topic chosen here is "digital-transformation narrative", but it's just one "lens" for the method. The research pipeline itself (report fetch → structured parsing → text+financial dual-line quantification → theory integration → consulting report delivery) is topic-agnostic and can migrate directly to listed-company operations analysis, sales & marketing analysis, HR analysis, financial-quality analysis, ESG analysis and other business-administration research scenes — just swap the placeholders in the prompt template (see "Prompts / Task Instructions" below).
The Task to Complete
Input: the name and stock code of an A-share listed company in industrial automation (this case anonymizes the specific company), and the analysis interval (2015–2025, 11 years).
Goals and deliverables:
- Auto-download all annual-report PDFs in the interval from cninfo (11 files)
- Parse the reports, focus on the MD&A section, do text semantic analysis: keyword frequency, topic model (LDA), narrative-intensity trajectory
- Extract financial data, do financial-metric and digital-investment quantification (growth, profitability, R&D intensity, per-capita efficiency, etc.)
- Bring in MBA strategy and digital-transformation theory as the analysis framework, combining theory with practice
- Generate a professional consulting-style, offline-openable HTML report: TOC nav, company-overview, core-problem analysis, improvement measures & strategic initiatives, charts (trend, comparison bar, radar, etc.), summary & conclusions
- Save all intermediate computation as Python scripts for full reproducibility
Behind this task definition is a methodology that migrates to any company, and the standard思路 for systematically studying a listed company:
- First-hand sources as the base: don't rely on second-hand research reports and news to patch together an impression; get ten years of annual reports straight from the official disclosure channel, so the analysis starts from un-retold first-hand material.
- Text + data dual-line cross-validation: what management's narrative (text semantics) says vs. what the financial data actually shows — only cross-checking the two lines can identify "narrative-vs-reality drift"; this case's "narrative decoupling" finding came from exactly this.
- Theoretical framework as the skeleton: use mature business-administration theory to organize findings and explain data, not pile metrics together; theory is the skeleton, data is the evidence.
- Fully reproducible: intermediate computation is saved as scripts; any conclusion can be re-checked and recomputed — this is what makes it "research" rather than "one-off generation", and the precondition for conclusions you dare take to defense, reporting or due diligence.
- Expert-team division mirrors the research flow: material retrieval → data engineering → analysis → visualization → writeup; the agents' role division maps one-to-one to a human research team, with no methodology compromise for the tool.
Skills Used
| Skill | Purpose | Source / install |
|---|---|---|
| Browser | Access cninfo, search and download the company's annual-report PDFs in the interval | WorkBuddy built-in |
| Local file read/write | Organize the directory structure for reports, intermediate data, scripts and deliverables | WorkBuddy built-in |
| Python code execution | Run reproducible scripts for PDF parsing, text semantic analysis, financial analysis, chart generation | WorkBuddy built-in |
Multi-agent collaboration is done by WorkBuddy's "Smart-Data Analysis Expert Team" (Agent Swarm): after the master instruction, the team auto-breaks-down the task, generates a to-do list, and the team lead assigns by role to knowledge-retrieval, data-science, report-writing, visualization-design members running in parallel. No extra Skill needed.
Preconditions
- WorkBuddy usable normally, can read/write local files and go online (to download reports from cninfo)
- WorkBuddy's bundled Python env (managed by WorkBuddy; no manual dependency install)
- The "Smart-Data Analysis Expert Team" (Agent Swarm multi-agent team) available
- No paid accounts or API keys needed (reports are public disclosure)
- The analysis target is a public listed company; reports in the interval are obtainable on cninfo
Steps in WorkBuddy
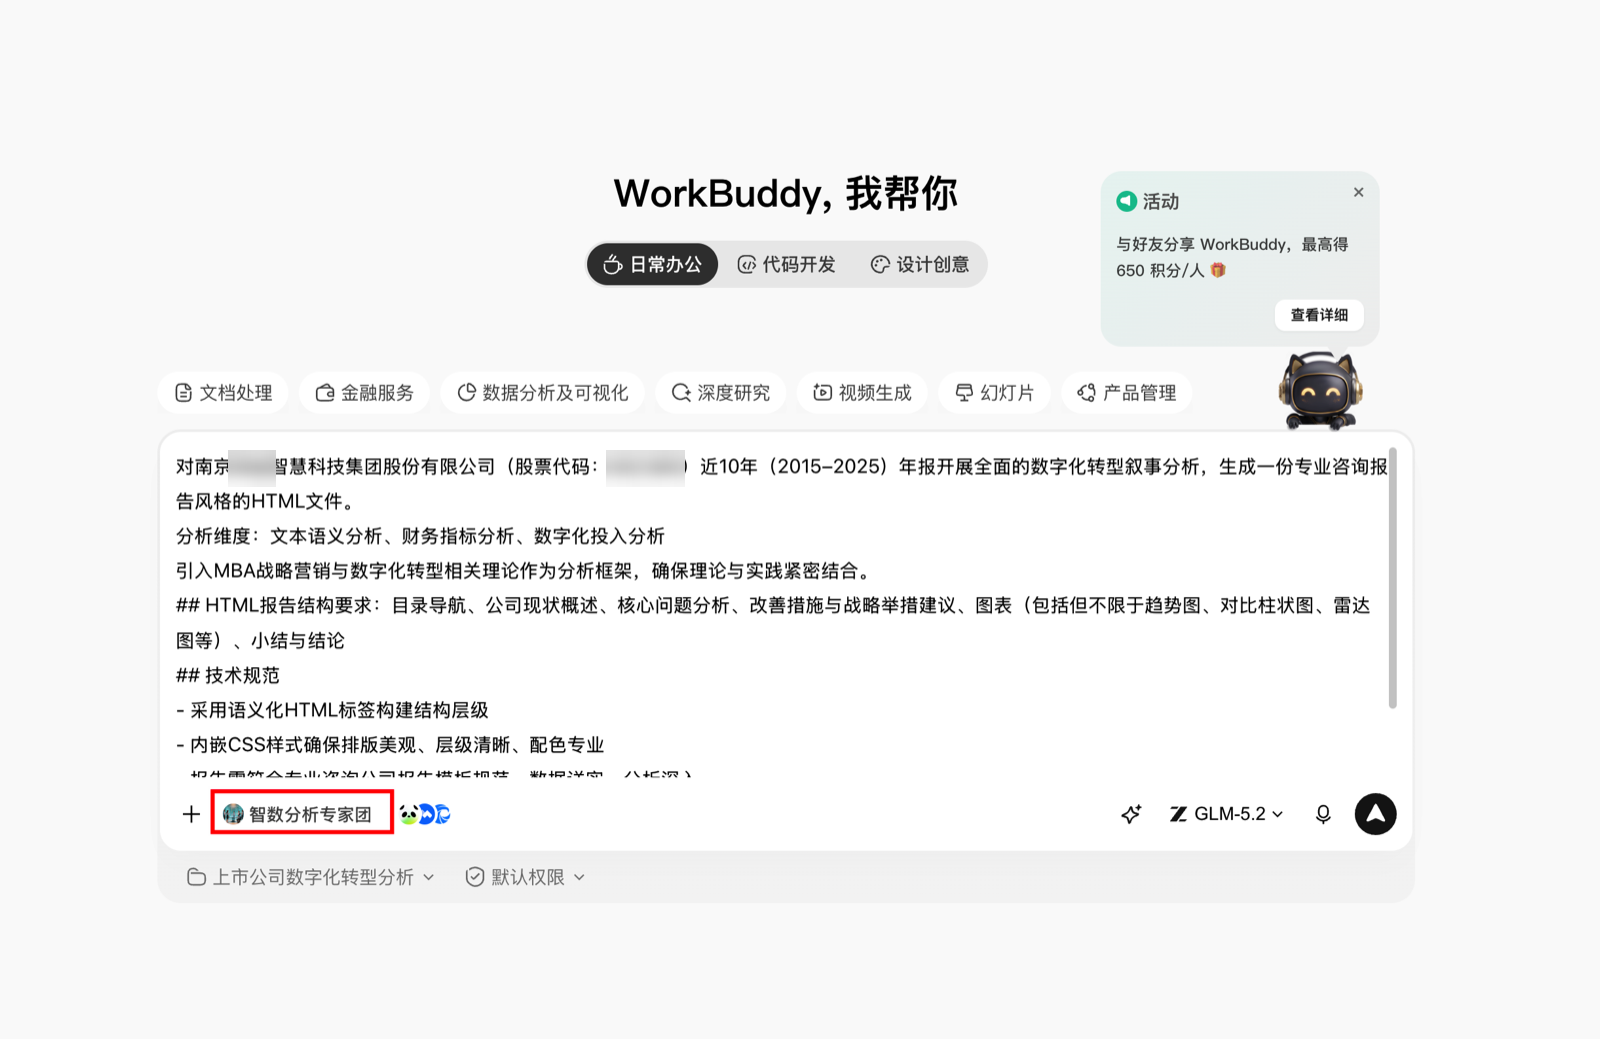
- Issue the master instruction: on the WorkBuddy home page enter the task instruction, and select "Smart-Data Analysis Expert Team" on the left of the input box. The instruction only needs to state the company, interval, analysis dimensions, theory framework, deliverables and technical spec (generalized template in the next section).
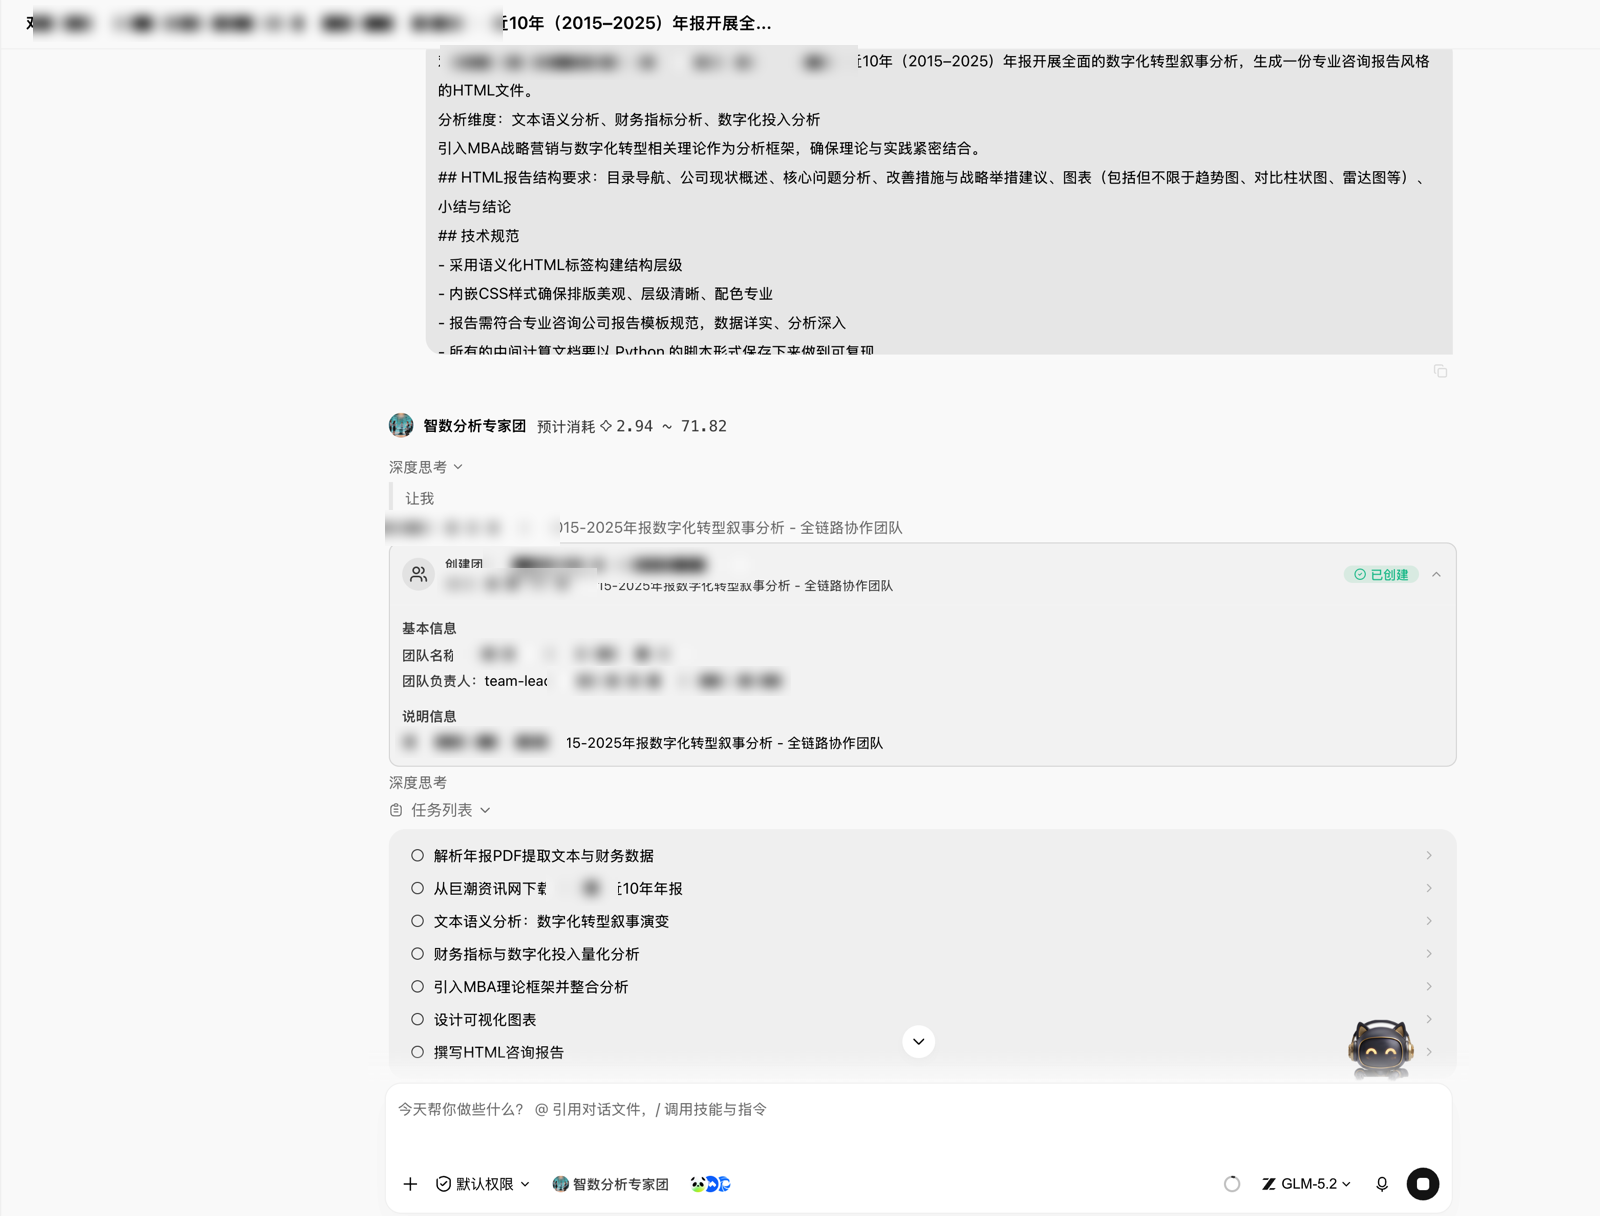
- The team breaks down the task: on receiving the instruction the team auto-creates a collaboration team (named "company-analysis topic"), and generates a to-do list: download reports → parse PDF to extract text and financials → text semantic analysis → financial-metric & digital-investment quantification → bring in MBA theory and integrate → design visualizations → write the HTML consulting report → assemble the comprehensive delivery.
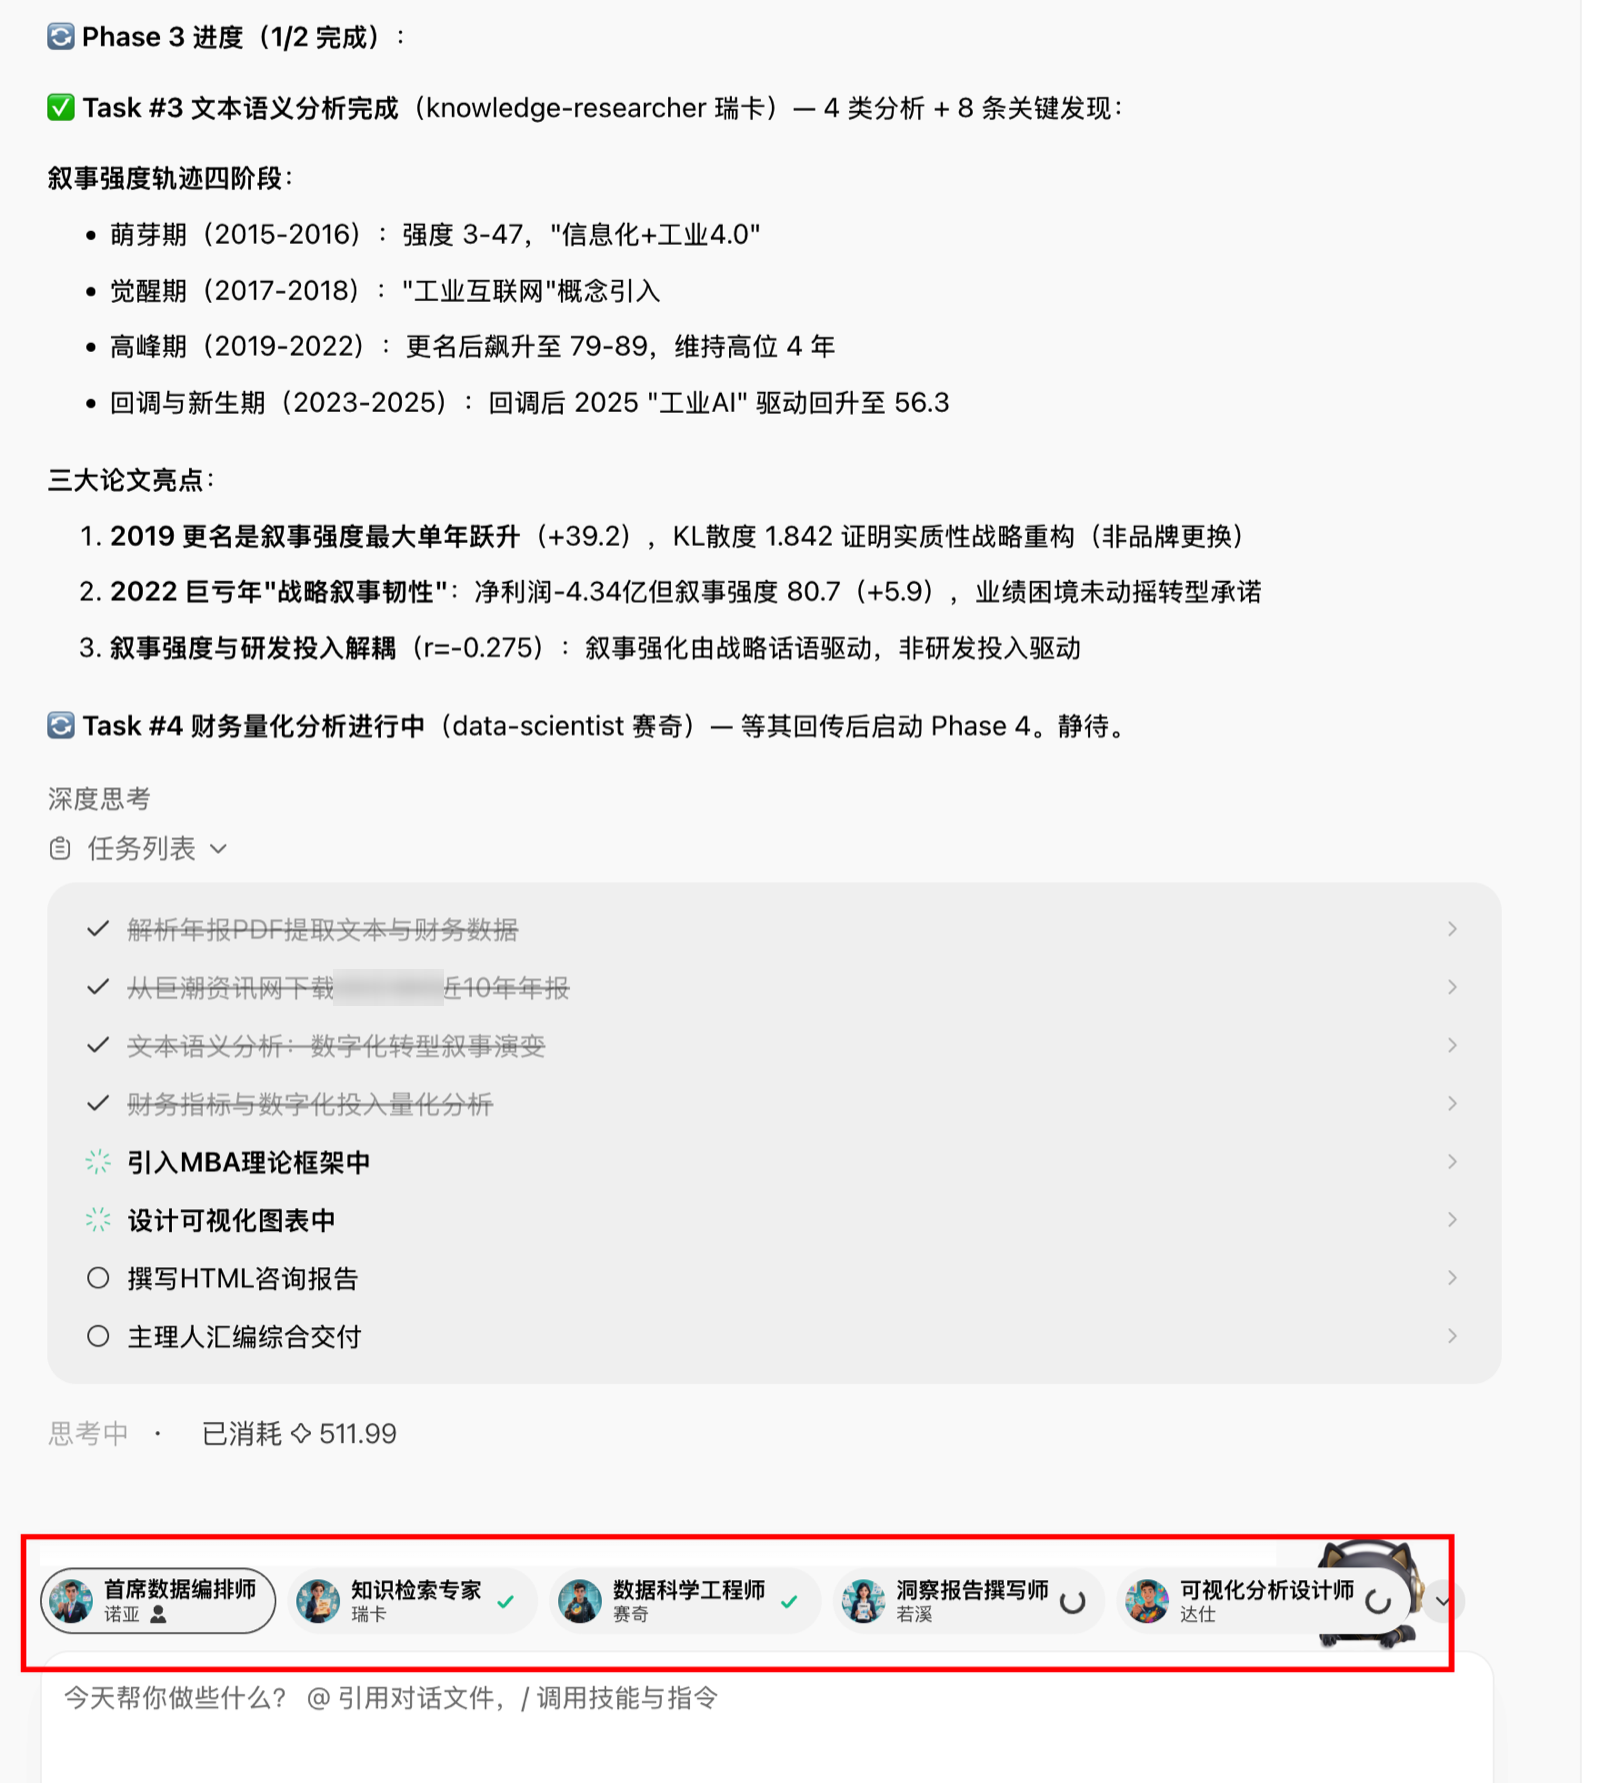
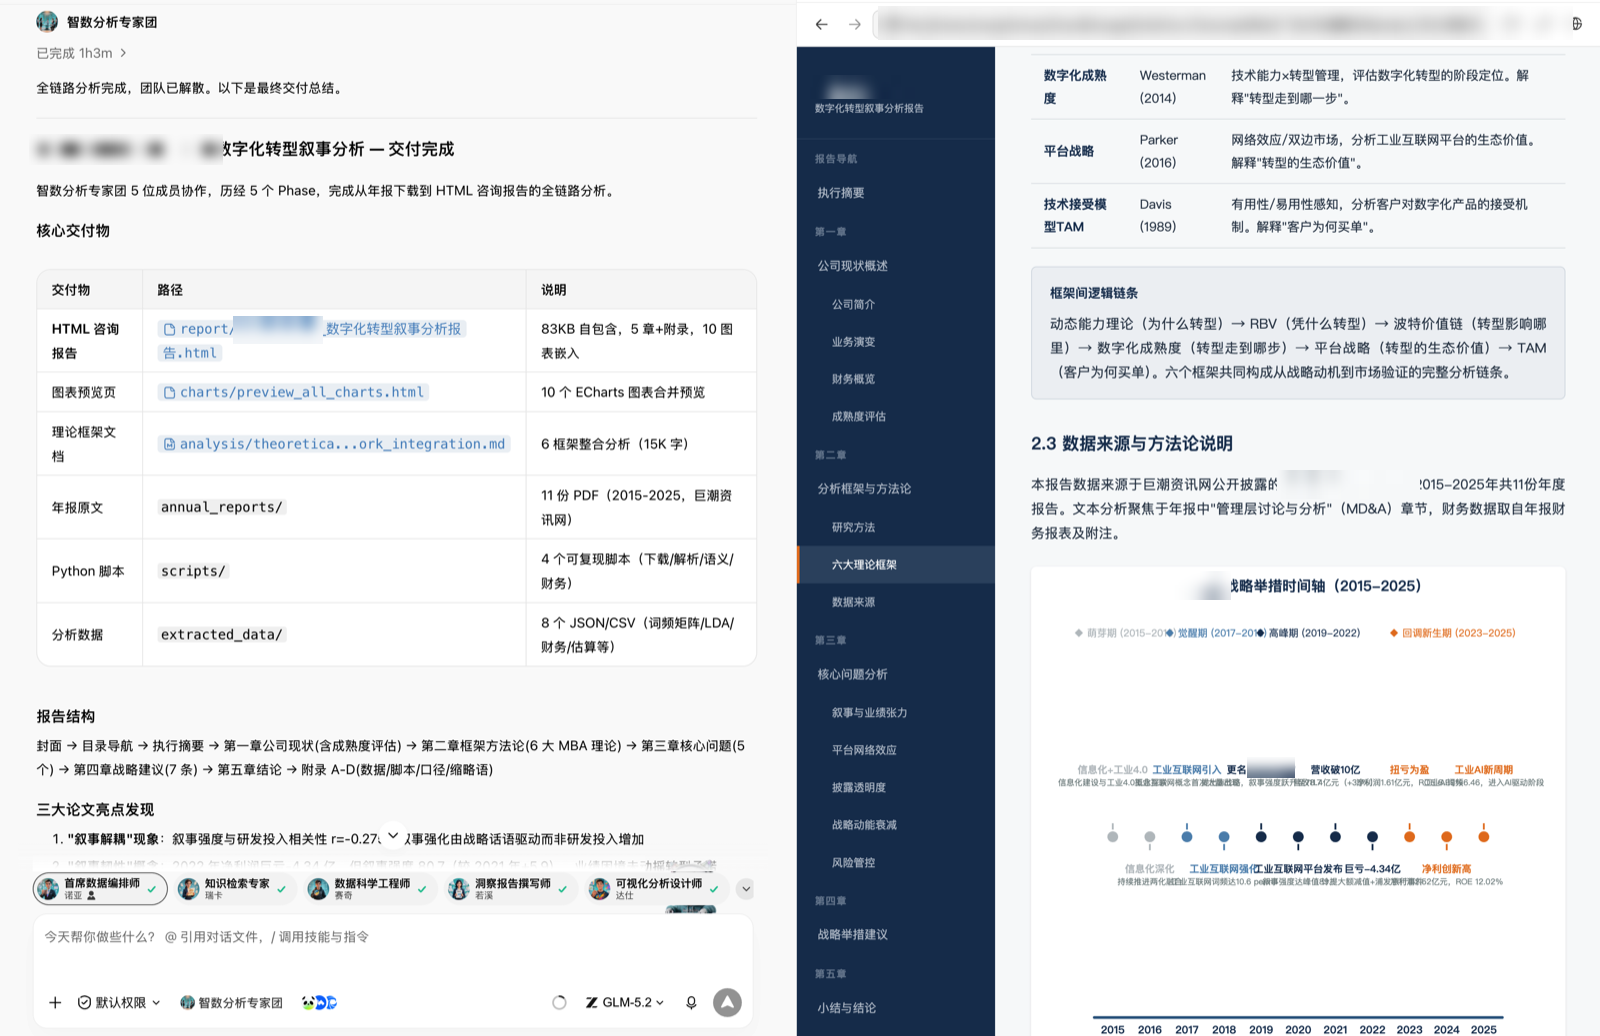
- Parallel execution by division: the team lead schedules 5 members across phases — chief data orchestrator, knowledge-retrieval expert, data-science engineer, insight report writer, visualization-analysis designer. Member avatars at the bottom show progress in real time (✓ done / spinner = running); on each completed task the lead reports a key finding, e.g. the "narrative-intensity four-stage trajectory".
- Artifacts persisted: during execution, report originals, parsed text & structured data, reproducible scripts and intermediate analysis results are written to
annual_reports/,extracted_text/,extracted_data/,scripts/etc., all traceable.
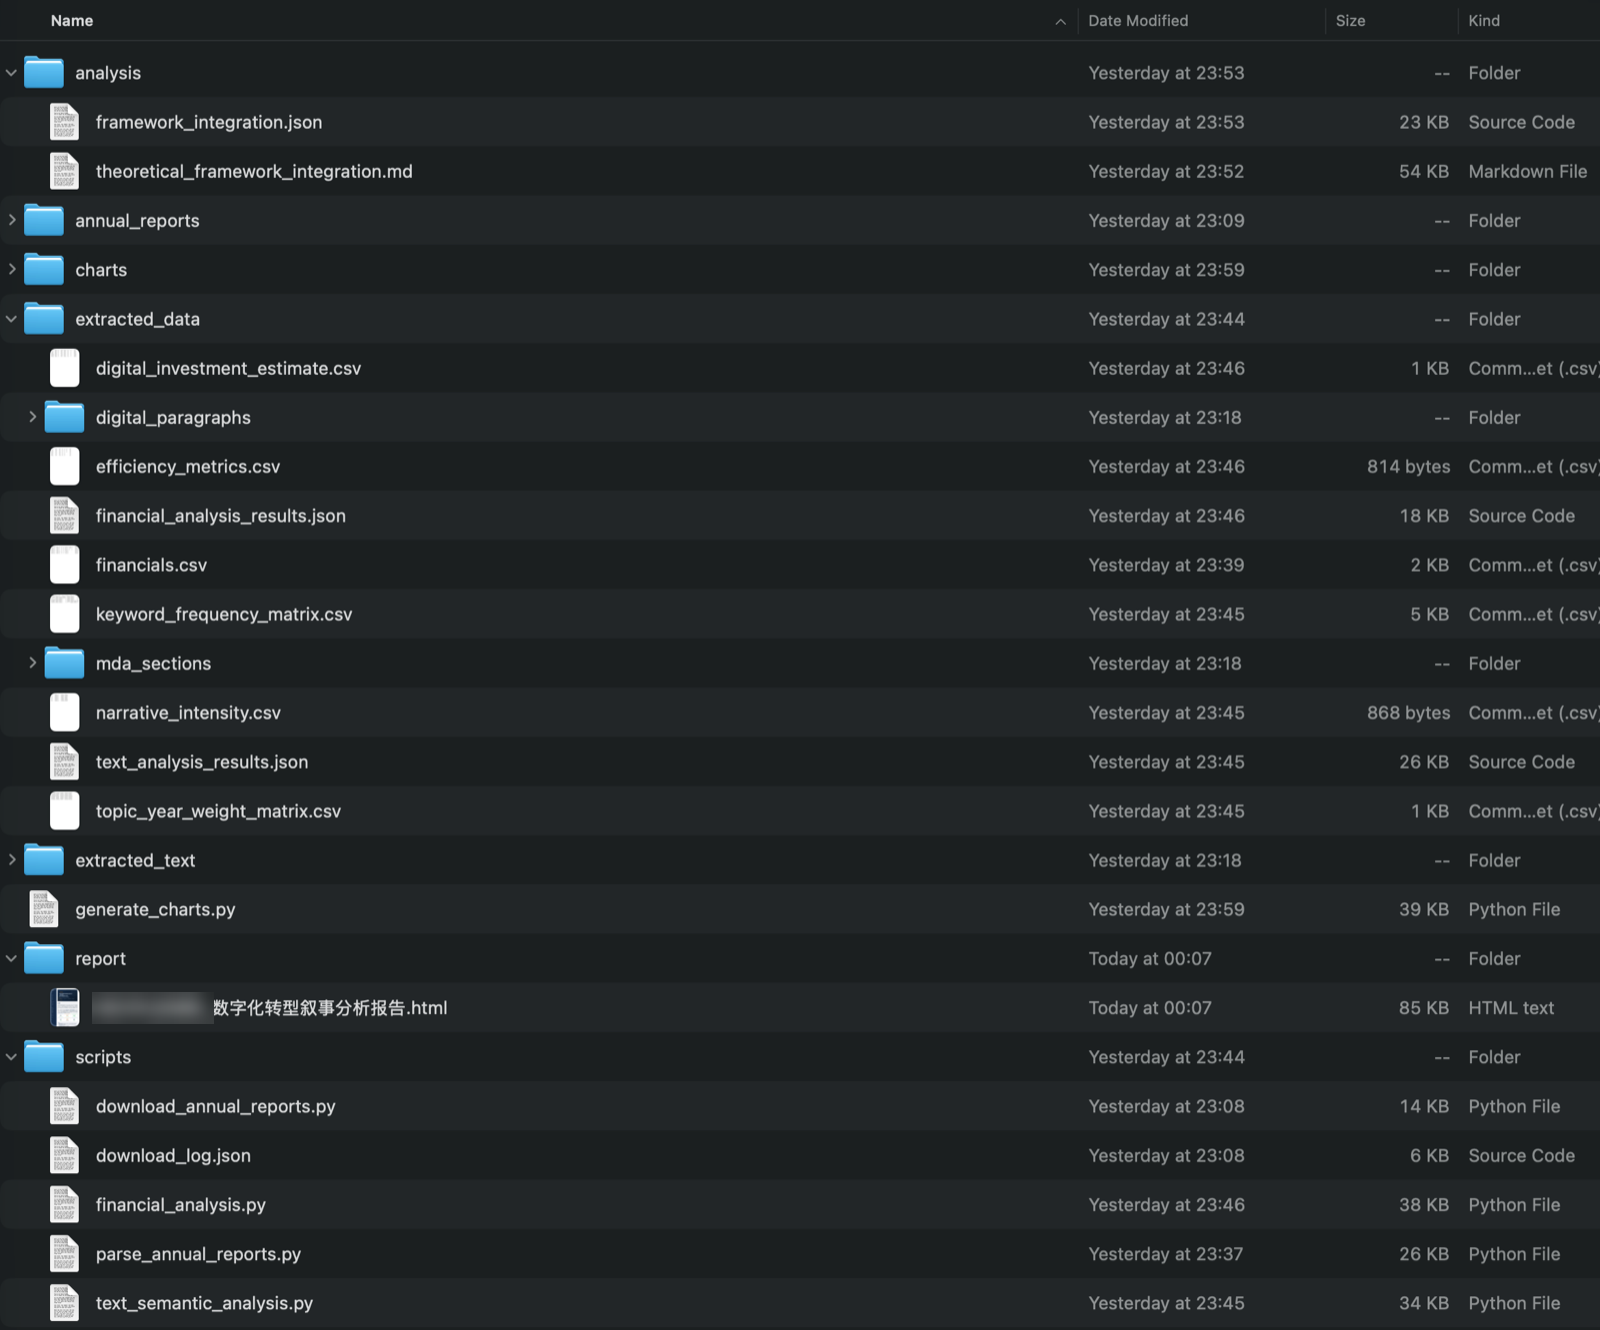
- Delivery summary: on completion the team gives a delivery summary (this case took ~1 hour), listing each deliverable's path and note; the human only needs to open the final HTML report to review.
Prompts / Task Instructions
Below is the generalized template of this case's prompt. Replace {placeholders} with concrete content to reuse on any listed company and any business-administration analysis topic:
Conduct a comprehensive {analysis topic, e.g. digital-transformation narrative analysis} on {company name} (stock code: {stock code}) for {analysis interval, e.g. 2015–2025} using {data source, e.g. annual reports},
and generate a professional consulting-style {deliverable format, e.g. HTML file}.

## Analysis dimensions
{analysis dimensions, e.g. text semantic analysis, financial-metric analysis, digital-investment analysis;
 for another topic swap to: operating efficiency, sales structure, HR efficiency, financial quality, ESG performance, etc.}

## Theoretical framework
Bring in {theory framework, e.g. MBA strategy marketing & digital-transformation theory} as the analysis framework,
ensuring theory and practice are tightly integrated.

## Deliverable structure requirements
{deliverable structure, e.g. TOC nav, company overview, core-problem analysis, improvement measures & strategic initiatives,
 charts (trend, comparison bar, radar, etc.), summary & conclusions}

## Technical spec
- Build structural hierarchy with semantic HTML tags, inline CSS; clean layout, clear hierarchy, professional palette
- The report should meet professional consulting-firm report-template standards: solid data, deep analysis
- All intermediate computation saved as Python scripts for reproducibility
- Raw data obtained as originals from {data-source channel, e.g. cninfo}
Placeholder-fill notes (the case's fill in parentheses):
{company name}/{stock code}: the analysis target (example wording: a smart-manufacturing enterprise / 6-digit code; this case fills an A-share listed company in industrial automation). To switch companies, only replace these two.{analysis interval}: recommend 5–10 full years for trend comparability (2015–2025, 11 reports).{data source}: the raw-material type and channel (cninfo public annual reports). Can also be prospectus, ESG report, earnings-call minutes, etc.{analysis dimensions}: decides what analysis tasks the team breaks out (text semantic analysis, financial-metric analysis, digital-investment analysis).{theory framework}: the theory system to bring in (MBA strategy marketing & digital-transformation theory — in execution the team landed on six frameworks: dynamic capabilities, resource-based view/VRIO, Porter value chain, digital maturity, platform strategy & network effects, technology acceptance model TAM).{deliverable structure}and{technical spec}: pin down "what the report looks like" so the deliverable form isn't left to the model to guess; keep the "intermediate computation saved as Python scripts" line — it's the key to re-checkability and re-computability.
This template suits all kinds of listed-company analysis in business administration: strategy & digital transformation, operating efficiency, sales & marketing, HR, financial quality, ESG, etc. — to switch topics, just change {analysis dimensions} and {theory framework}.
Effect in WorkBuddy
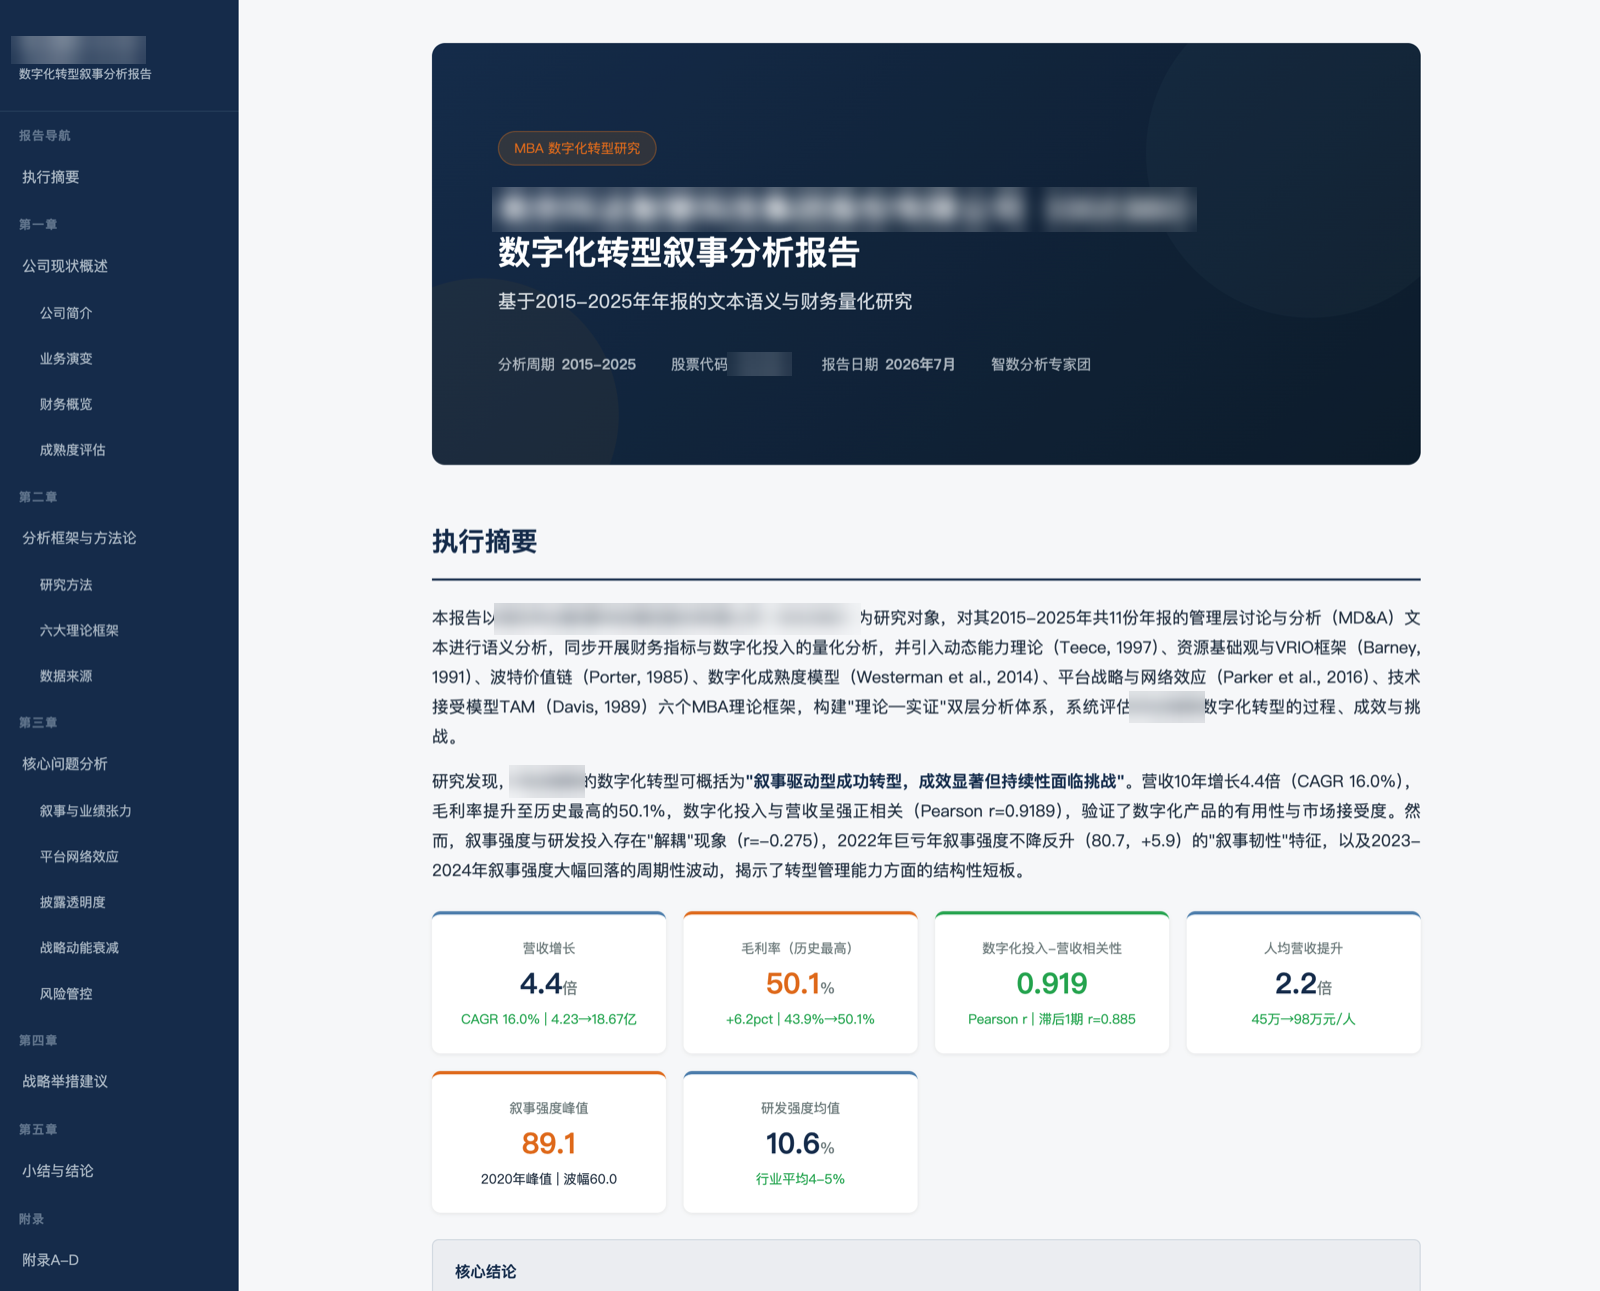
Final deliverable: an 85 KB self-contained HTML consulting report (double-click to open offline), TOC nav on the left, body with executive summary, five chapters and appendix A–D, 10 embedded charts. The front page gives the executive summary and six core metric cards: revenue grew 4.4× over ten years (CAGR 16.0%), gross margin up to a record 50.1%, digital-investment strongly correlated with revenue (Pearson r=0.919), per-capita revenue up 2.2×, narrative-intensity peak 89.1, R&D intensity mean 10.6%.
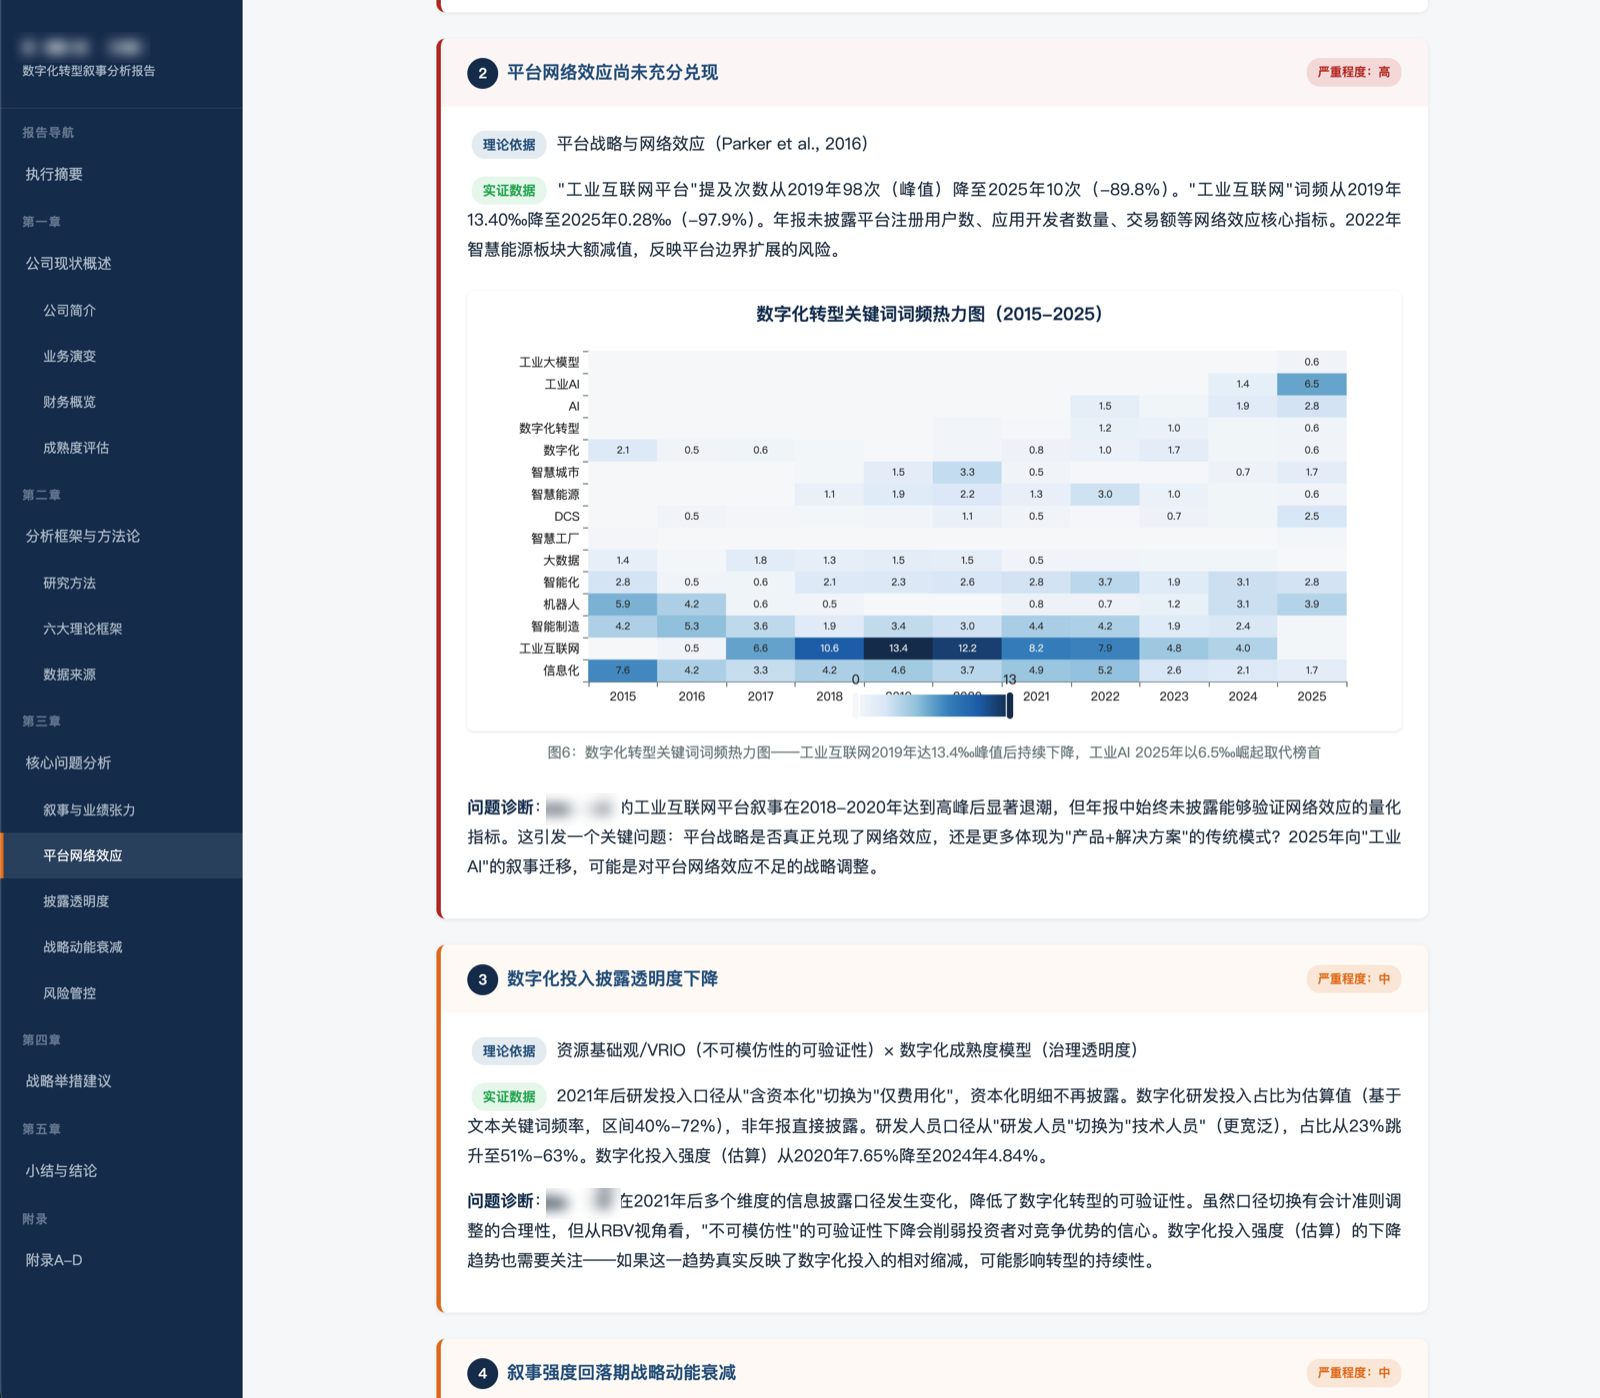
Core-problem analysis: chapter 3 presents five core problems as "problem cards", each marking severity, theory basis and empirical data. E.g. "platform network effects not yet fully realized": per platform-strategy & network-effects theory (Parker et al., 2016), backed by the "digital-transformation keyword-frequency heatmap (2015–2025)" — "industrial internet" frequency falling from a 2019 peak, "industrial AI" rising to take the top spot in 2025.
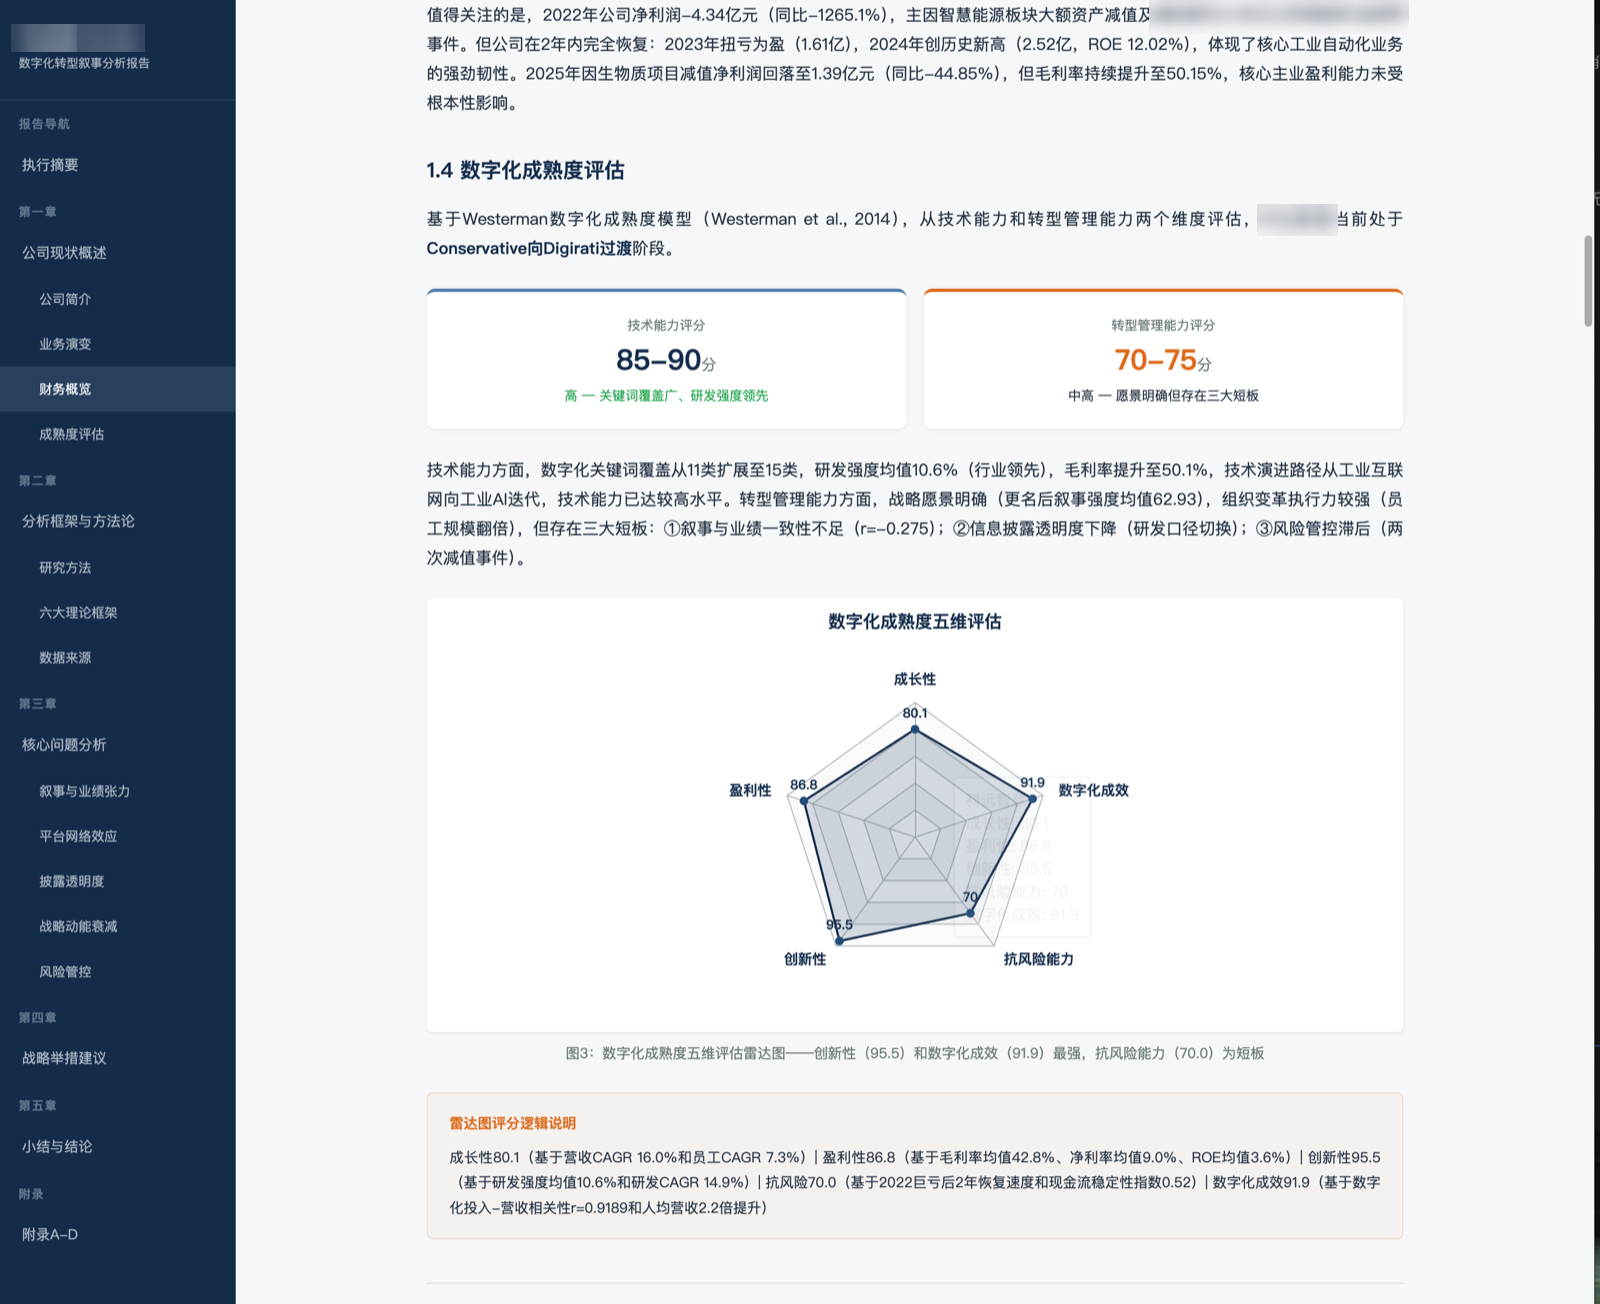
Theory-data combination: based on the Westerman digital-maturity model, scores two dimensions (tech capability & transformation-management capability, 85–90 / 70–75), with a "digital-maturity five-dimension assessment" radar (growth, digital effect, risk-resistance, innovation, profitability), each score mapping to a concrete financial or text metric with the scoring logic noted below.
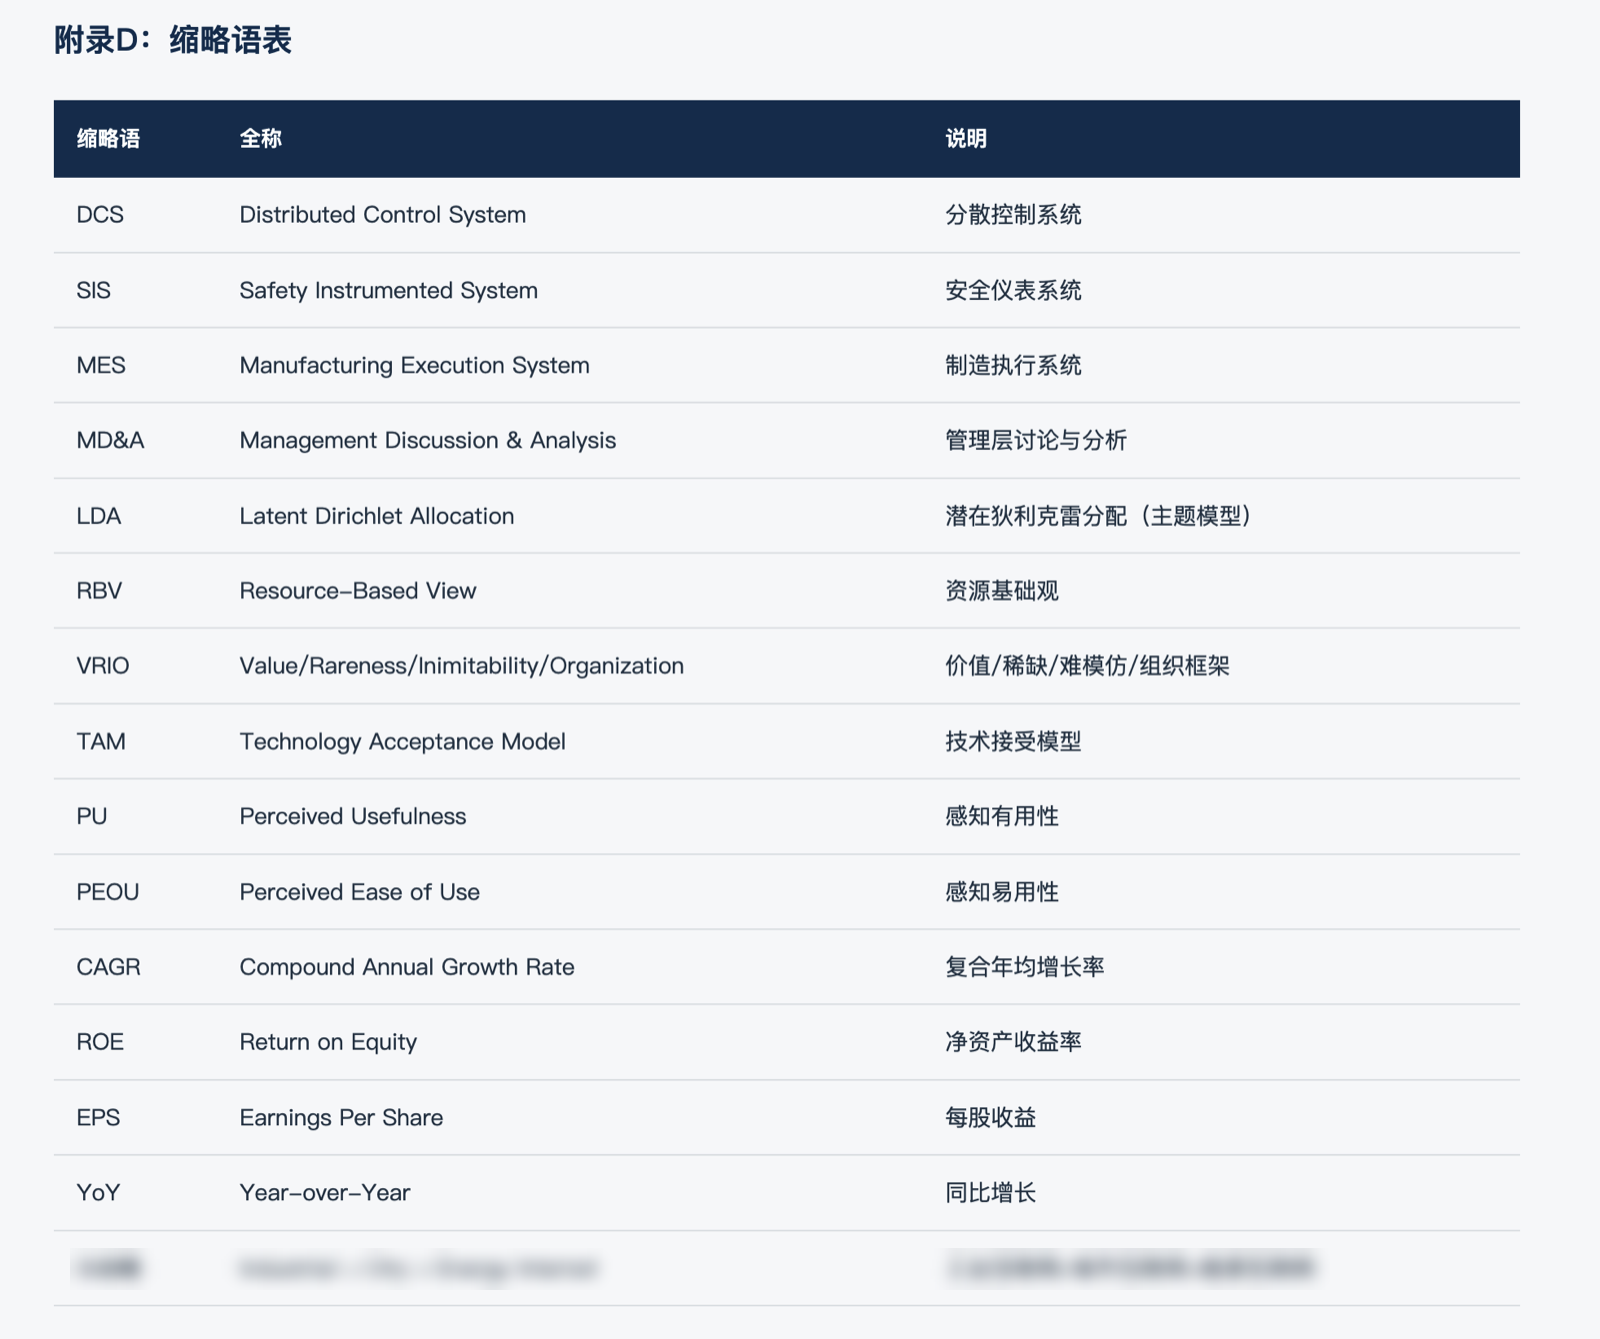
Appendix professionalism: the report end has an abbreviation table (DCS, MD&A, LDA, RBV, VRIO, TAM, CAGR, ROE, etc., each with full name and definition), plus four appendices (data sources, script notes, definition notes), meeting consulting-deliverable standards.
Delivery summary in WorkBuddy: on completion the team gives a delivery list — the HTML consulting report, a 10-ECharts-chart merged preview page, a six-framework integration analysis doc (~15k words), 11 report originals, 4 reproducible Python scripts, 8 intermediate analysis data files (JSON/CSV), plus three paper-grade highlight findings like the "narrative decoupling" phenomenon (narrative-intensity vs R&D-investment correlation r=-0.275) and "strategic-narrative resilience" in a loss year (narrative intensity rising instead of falling in a big-loss year).
📎 Report original (anonymized, openable online): company-deep-research-report.html
Acceptance Criteria
- Reports complete: 11 PDFs in
annual_reports/, covering each year 2015–2025, all from cninfo, one-to-one with the company's actual disclosures (note: exclude report summaries, English versions, correction announcements and other干扰 files) - Scripts reproducible: the 4 scripts in
scripts/(download, parse, text semantic analysis, financial analysis) run independently; re-run results match the 8 intermediate data files inextracted_data/(frequency matrix, LDA topic weights, narrative intensity, financial metrics, etc. JSON/CSV) - Report openable: the final HTML is self-contained (inline CSS, embedded charts), opens offline on double-click; left TOC nav jumps; the five chapters (company overview, analysis framework & methodology, core-problem analysis, strategic-initiative suggestions, summary & conclusions) and appendix A–D are complete
- Numbers verifiable: key numbers in the report (revenue 423M→1.867B, CAGR 16.0%, gross margin 50.1%, Pearson r=0.9189, etc.) reconcile with the report originals and
extracted_data/intermediate results; recommend human spot-checking 3–5 - Theory grounded: every theory framework has corresponding empirical data support, and the theory-integration logic is fully documented in
analysis/theoretical_framework_integration.md— not an empty line in the report
Issues Encountered
- Report PDF parsing is hard: report layouts are complex (multi-column, scans, complex tables); direct full-text extraction easily produces garbled text, broken lines and table misalignment. Solution: split by section, focus text-dense sections like MD&A for semantic analysis, run financials through structured extraction separately, with error tolerance and logging in the parsing scripts.
- cninfo download needs filtering: the same company & year may have full report, summary, English version, cancellation/correction and other announcements simultaneously; the download script must filter by announcement type and dedupe, and control access rate to avoid triggering site limits.
- Disclosure-scope mid-stream change: after 2021 the company's R&D-investment scope switched from "including capitalized" to "expense-only", with capitalized detail no longer disclosed, so some digital-investment metrics can only be given as estimated ranges. The report explicitly marks such scope switches rather than connecting differently-scoped numbers into one trend line — this will almost certainly recur when reusing on another company.
- Semantic-analysis compute volume: 11 years of MD&A full text for tokenization, frequency stats and LDA topic modeling is time-consuming; the team split it into an independent phase, with intermediate results persisted (frequency matrix, topic-weight matrix CSV), enabling resumable re-runs on failure.
Safety and Limits
- Annual reports are public disclosure; the data source is legal and compliant; this case contains no personal privacy or enterprise-sensitive data and can be publicly shared.
- Downloading reports requires online access to cninfo; control crawl rate, only download files needed for analysis, follow the target site's terms, and don't bulk-crawl irrelevant announcements.
- The report is AI-generated and does not constitute investment advice; narrative intensity and digital-investment estimates are text-mining-derived indicators, not official company-disclosure definitions — verify against the report originals before citing.
- PDF auto-parsing may miss individual tables or numbers; always human spot-check key financial metrics before official use.
- The whole flow only reads/writes the local working directory; execution generates many intermediate artifacts (scripts, CSV, logs); distinguish deliverables from process files when archiving.
How to Reuse
The most worth-taking thing from this case is the research paradigm, not any one analysis topic. When business analysts take any listed company — due diligence, competitor analysis, industry research, pre-job target-company understanding, coursework case — anywhere needing "quickly build a complete, credible, verifiable understanding of a company", the same research pipeline applies directly: first-hand sources → structured parsing → text+data dual-line cross-validation → theory-organized findings → reproducible delivery.
- Switching topic is just switching the "lens": operations analysis (capacity, supply chain, cost structure), sales & marketing analysis (channels, customer structure, regional distribution), HR analysis (staff structure, per-capita efficiency, pay & incentives), financial-quality analysis (cash flow, solvency, impairment risk), ESG analysis — just rewrite the
{analysis dimensions}and{theory framework}placeholders; the pipeline stays as-is. - Switching company: replace
{company name},{stock code},{analysis interval}in the template; the download script and analysis flow reuse as-is; first confirm the target company's reports are complete on cninfo. - Switching raw material: the same template also suits prospectus, ESG/sustainability reports, earnings-call minutes, broker-research collections — just swap
{data source}for the channel. - Keep the "reproducible" hard requirement: "all intermediate computation saved as Python scripts" is the single most-reusable line in the case — it makes any conclusion re-checkable and re-computable, turning AI analysis from "looks professional" to "stands up to scrutiny", and is what lets this method be called "research".
- Multi-agent teams suit long-chain tasks: any task needing "download → clean → analyze → visualize → writeup" in one go is more stable handed to an expert team for breakdown than driven round-by-round yourself; its division (retrieval, data engineering, analysis, visualization, writeup) is isomorphic to a human research team, and intermediate reporting helps human-confirm definitions at key nodes.