Clean 119 Store Excel Files With WorkBuddy and Generate an Interactive Ops Dashboard
Scene Description
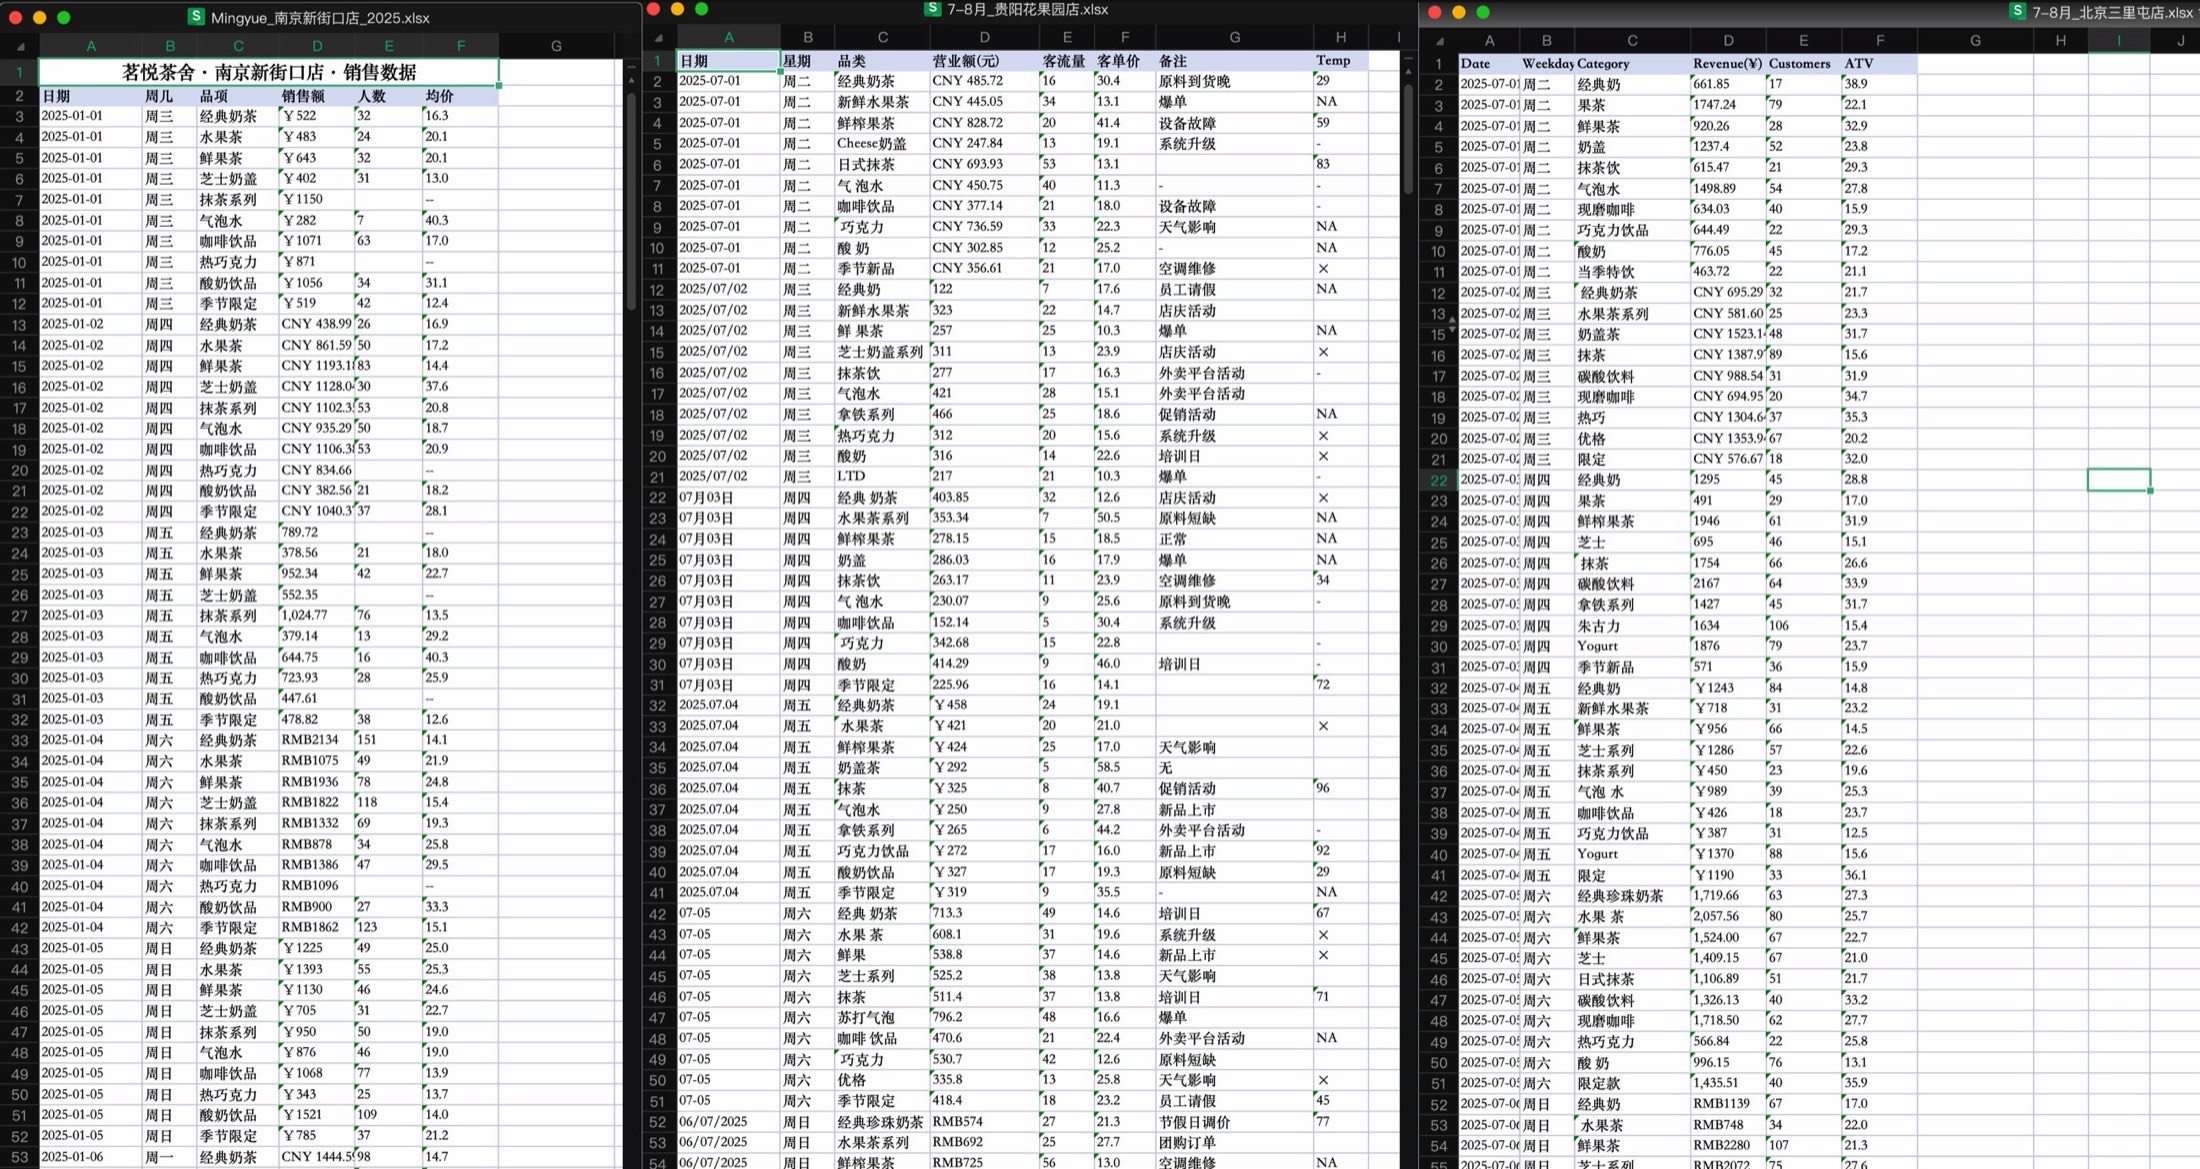
The tea-chain brand "Mingyue Teahouse" (teaching mock data) has about 50 stores nationwide; each store records daily sales detail in Excel and汇总 to HQ. The 119 .xlsx files actually received have very typical problems:
- Three column-name systems coexisting: Chinese (date/item/sales), Chinese variants (weekday/category/revenue(¥)/footfall), English (Date/Category/Revenue(¥)/Customers/ATV)
- Inconsistent structure: 14 files have a big title row (the real header is on row 2); 24 files split into multiple sheets by "month" or "quarter"
- 6 date formats:
2025-01-01,2025/01/01,2025.01.01,03/03/2025(day/month/year),03月02日(year missing),07-05(year/month/day missing) - Noisy amount fields: mixed ¥/CNY/RMB/元, thousand-separator commas, plus "to backfill", "--" missing markers and negative returns
- Same store scattered across files: e.g. Beijing Sanlitun's data is spread across 6 files
Manually merging and cleaning this kind of data usually takes 6–7 hours and is error-prone. This case shows how to hand the work to WorkBuddy in one pass and get deliverables you can report directly.
The Task to Complete
Input: 119 messy store-sales Excel files in sales_data/.
Goals and deliverables:
- Merge and clean all store data into one clean summary table (unified format, deduped, clear definitions)
- Generate a multi-sheet Excel ops-analysis report: region summary, city summary, TOP10 stores, category share, monthly trend
- Generate an offline-openable interactive HTML dashboard: clicking any chart dimension triggers a global linked recompute ("cockpit"-style experience)
Skills Used
| Skill | Purpose | Source / install |
|---|---|---|
| xlsx | Read/write Excel, generate analysis reports with charts and live formulas, recalc validation | WorkBuddy built-in |
The rest (file traversal, Python data cleaning, HTML/ECharts dashboard generation) is done by WorkBuddy's general file read/write and code-execution capability — no extra Skill needed.
Preconditions
- WorkBuddy usable normally, can read/write local files
- WorkBuddy's bundled Python env (pandas + openpyxl, managed by WorkBuddy; no manual install)
- Input files: store-sales Excel in one directory (119
.xlsxhere) - No external accounts or API keys needed
Steps in WorkBuddy
- Recon: have WorkBuddy scan the directory first, report file count, format diffs and dirty-data types; get a plan before acting.
- Clean & merge: after confirming the plan, WorkBuddy writes and runs a cleaning script, outputting
cleaned_data/summary.xlsx(summary / store stats / data-quality report sheets), keeping a reproducible script. - Generate Excel analysis report: from the summary table, generate an 8-sheet
store-ops-analysis-report.xlsx; shares, totals, ATV, MoM all use Excel live formulas (recompute on source-data update), validated with recalc to 0 formula errors. - Generate HTML dashboard: require "clickable dimension linkage, Deloitte-style deliverable"; WorkBuddy uses ECharts (downloaded locally, offline-usable) to produce
store-ops-dashboard.html. - Upgrade to cockpit: add one instruction to make the filter panel "click-to-link-everywhere" global linkage, with the trend chart supporting drag-to-select month ranges (reuse the optimized round-3 prompt below to get these requirements in one go).
At each step WorkBuddy reports what it found and what assumptions it made; the human only confirms definitions at key nodes.
Prompts / Task Instructions
The actual run had three conversational rounds. Round 1 is the original wording; rounds 2 and 3 are optimized on the original (see notes after each); reuse the optimized versions directly.
Round 1 (clean & merge, original):
I have a tea brand called "Mingyue Teahouse"; my goal is for you to do a data-cleaning pass for me. After cleaning all the data, output to `cleaned_data/summary.xlsx`. My data may have one or more of these problems:
1. Inconsistent date formats
2. Inconsistent column names
3. Possibly duplicate records
4. Possibly empty rows or invalid data
Help me:
1. Read all files
2. Unify date formats
3. Unify column names
4. Remove duplicate records and invalid data
5. Merge into one clean summary table
Round 2 (generate analysis report, optimized):
From the just-cleaned summary table, generate an Excel report for store-ops analysis and promotion strategy,
saved as analysis/store-ops-analysis-report.xlsx, one sheet per analysis, at least including:

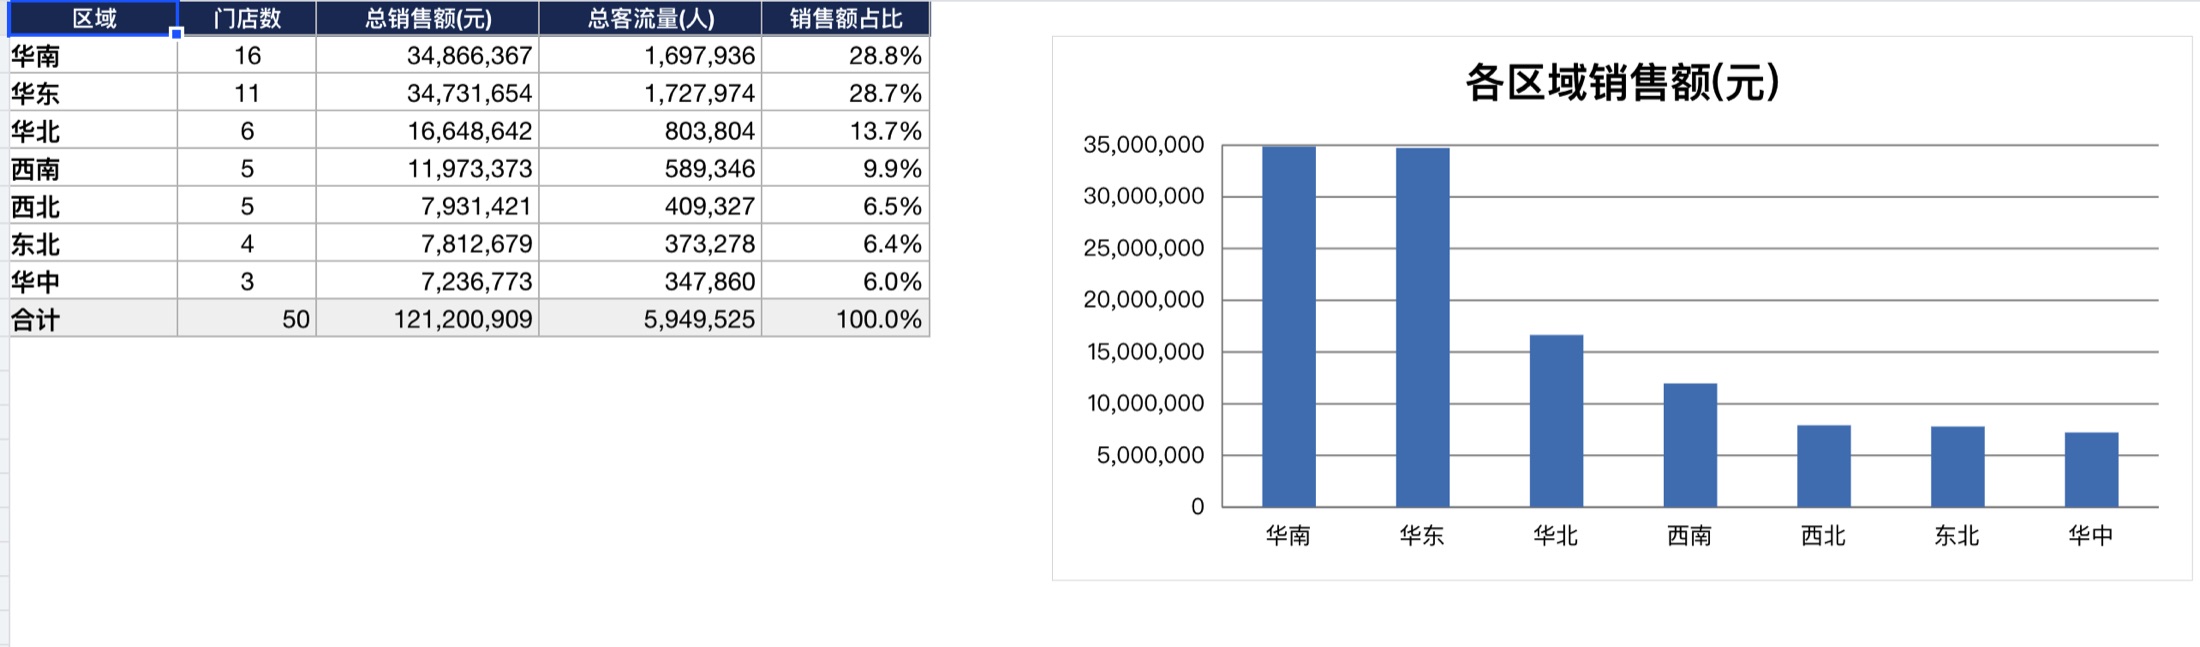
1. By region: sales ranking and share for the seven major geographic regions (with bar chart)
2. By city: city sales ranking (with bar chart)
3. Find the TOP10 stores by sales (with ATV and share, with bar chart)
4. Analyze each category's sales share (with pie chart)
5. Monthly trend analysis: full-year 12-month sales and footfall (dual-axis line chart) + MoM

Requirements: all shares, totals, ATV, MoM use Excel live formulas; auto-recompute on source-data update;
finally add an "Insights & Recommendations" sheet with actionable ops and promotion suggestions based on the data.
Optimization points: clarified the output file and format (Excel, one sheet per analysis, with charts), added the live-formula requirement (report auto-recomputes on source update), and turned the "do strategy" intent into a concrete "Insights & Recommendations" sheet — the original only said "make a report", leaving the deliverable form to the model to guess.
Round 3 (interactive dashboard, optimized):
From the summary table, use a suitable interactive library (e.g. ECharts) to generate an HTML dashboard. It's not just a static report;
I can click any dimension and the page content updates. Specific requirements:

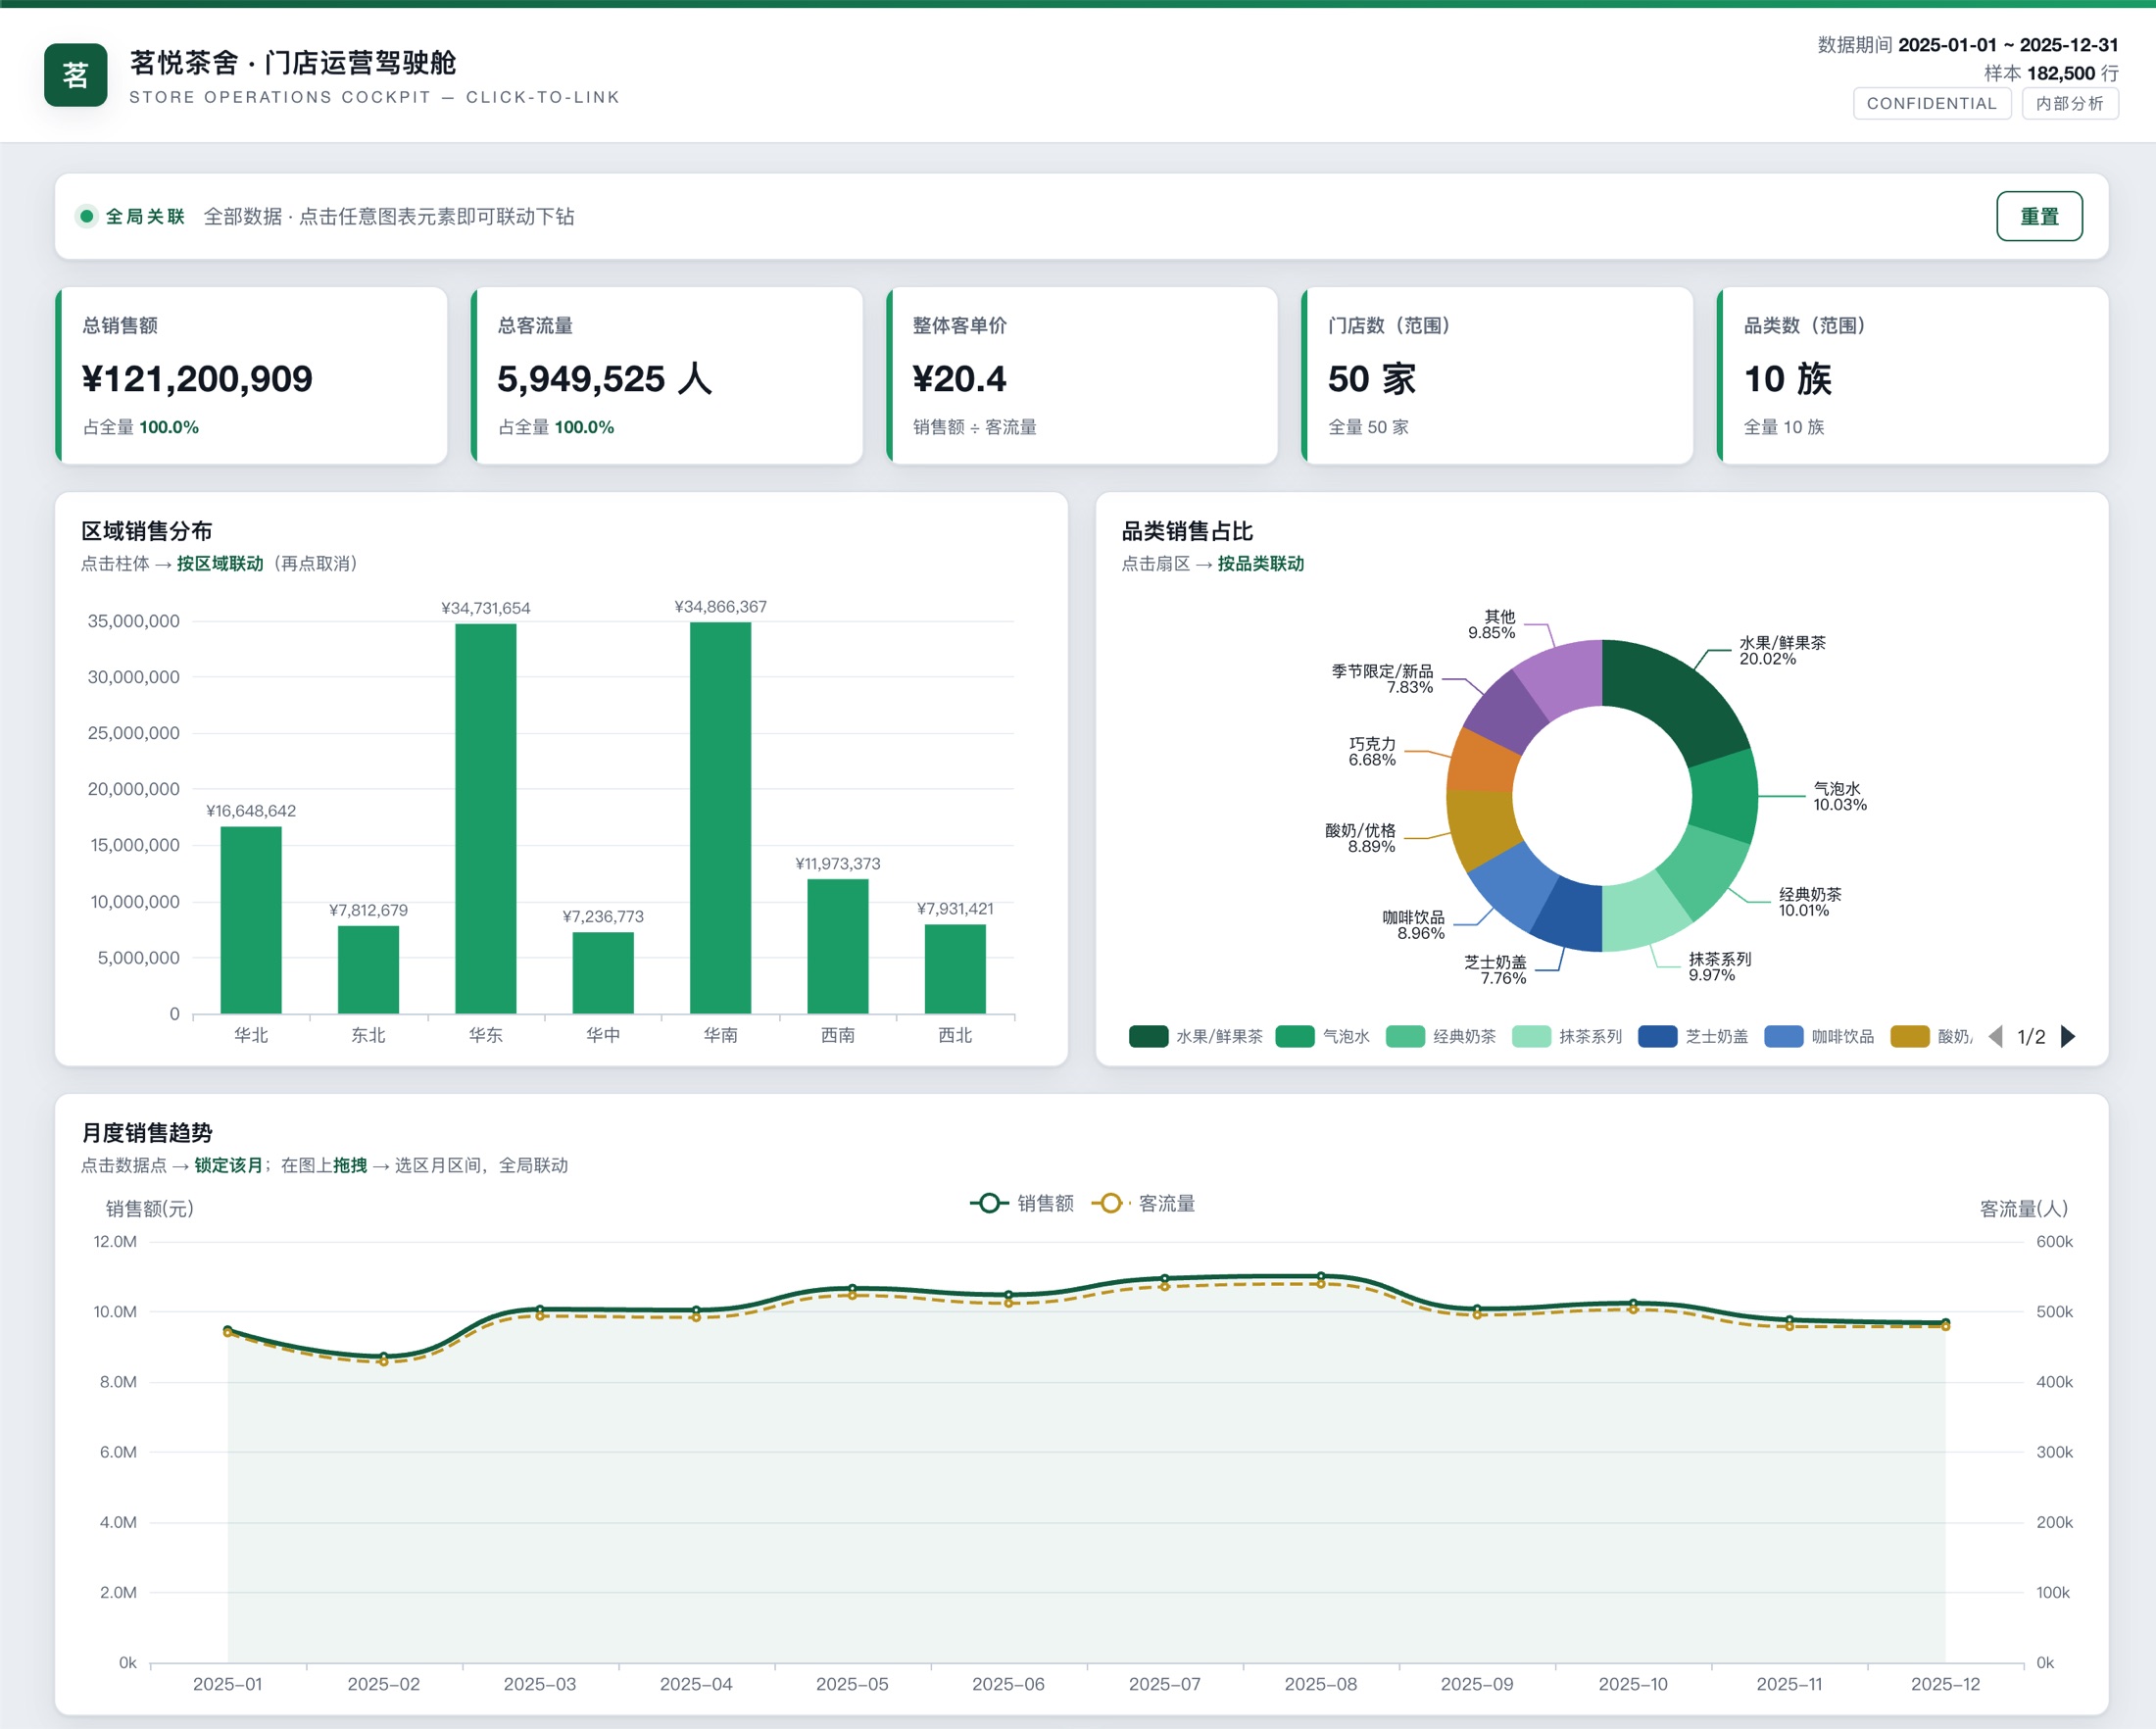
1. Clicking any chart bar/slice sets that dimension as the current filter; all KPIs, charts and detail tables recompute in real-time linkage
2. The monthly trend chart supports drag-to-select month ranges
3. The clicked-dimension chart stays fully displayed (only highlights the selected item); other dimensions narrow, to avoid "after clicking only one bar left"
4. The top has a global status bar; can clear filters per-dimension and one-click reset
5. Dependencies downloaded locally; double-click to open offline
6. Visual style carefully designed; professional, like what a consulting firm such as Deloitte outputs
Optimization points: translated "click any dimension" into explicit interaction rules (click-to-filter, global linkage, drag-to-select-month, keep context, resettable), and added the hard offline-usable requirement — to avoid generated HTML depending on online CDN and breaking offline or after sharing. The "like Deloitte" style hint keeps the original wording (the model gets it), but interaction behavior must be written clearly.
Effect in WorkBuddy
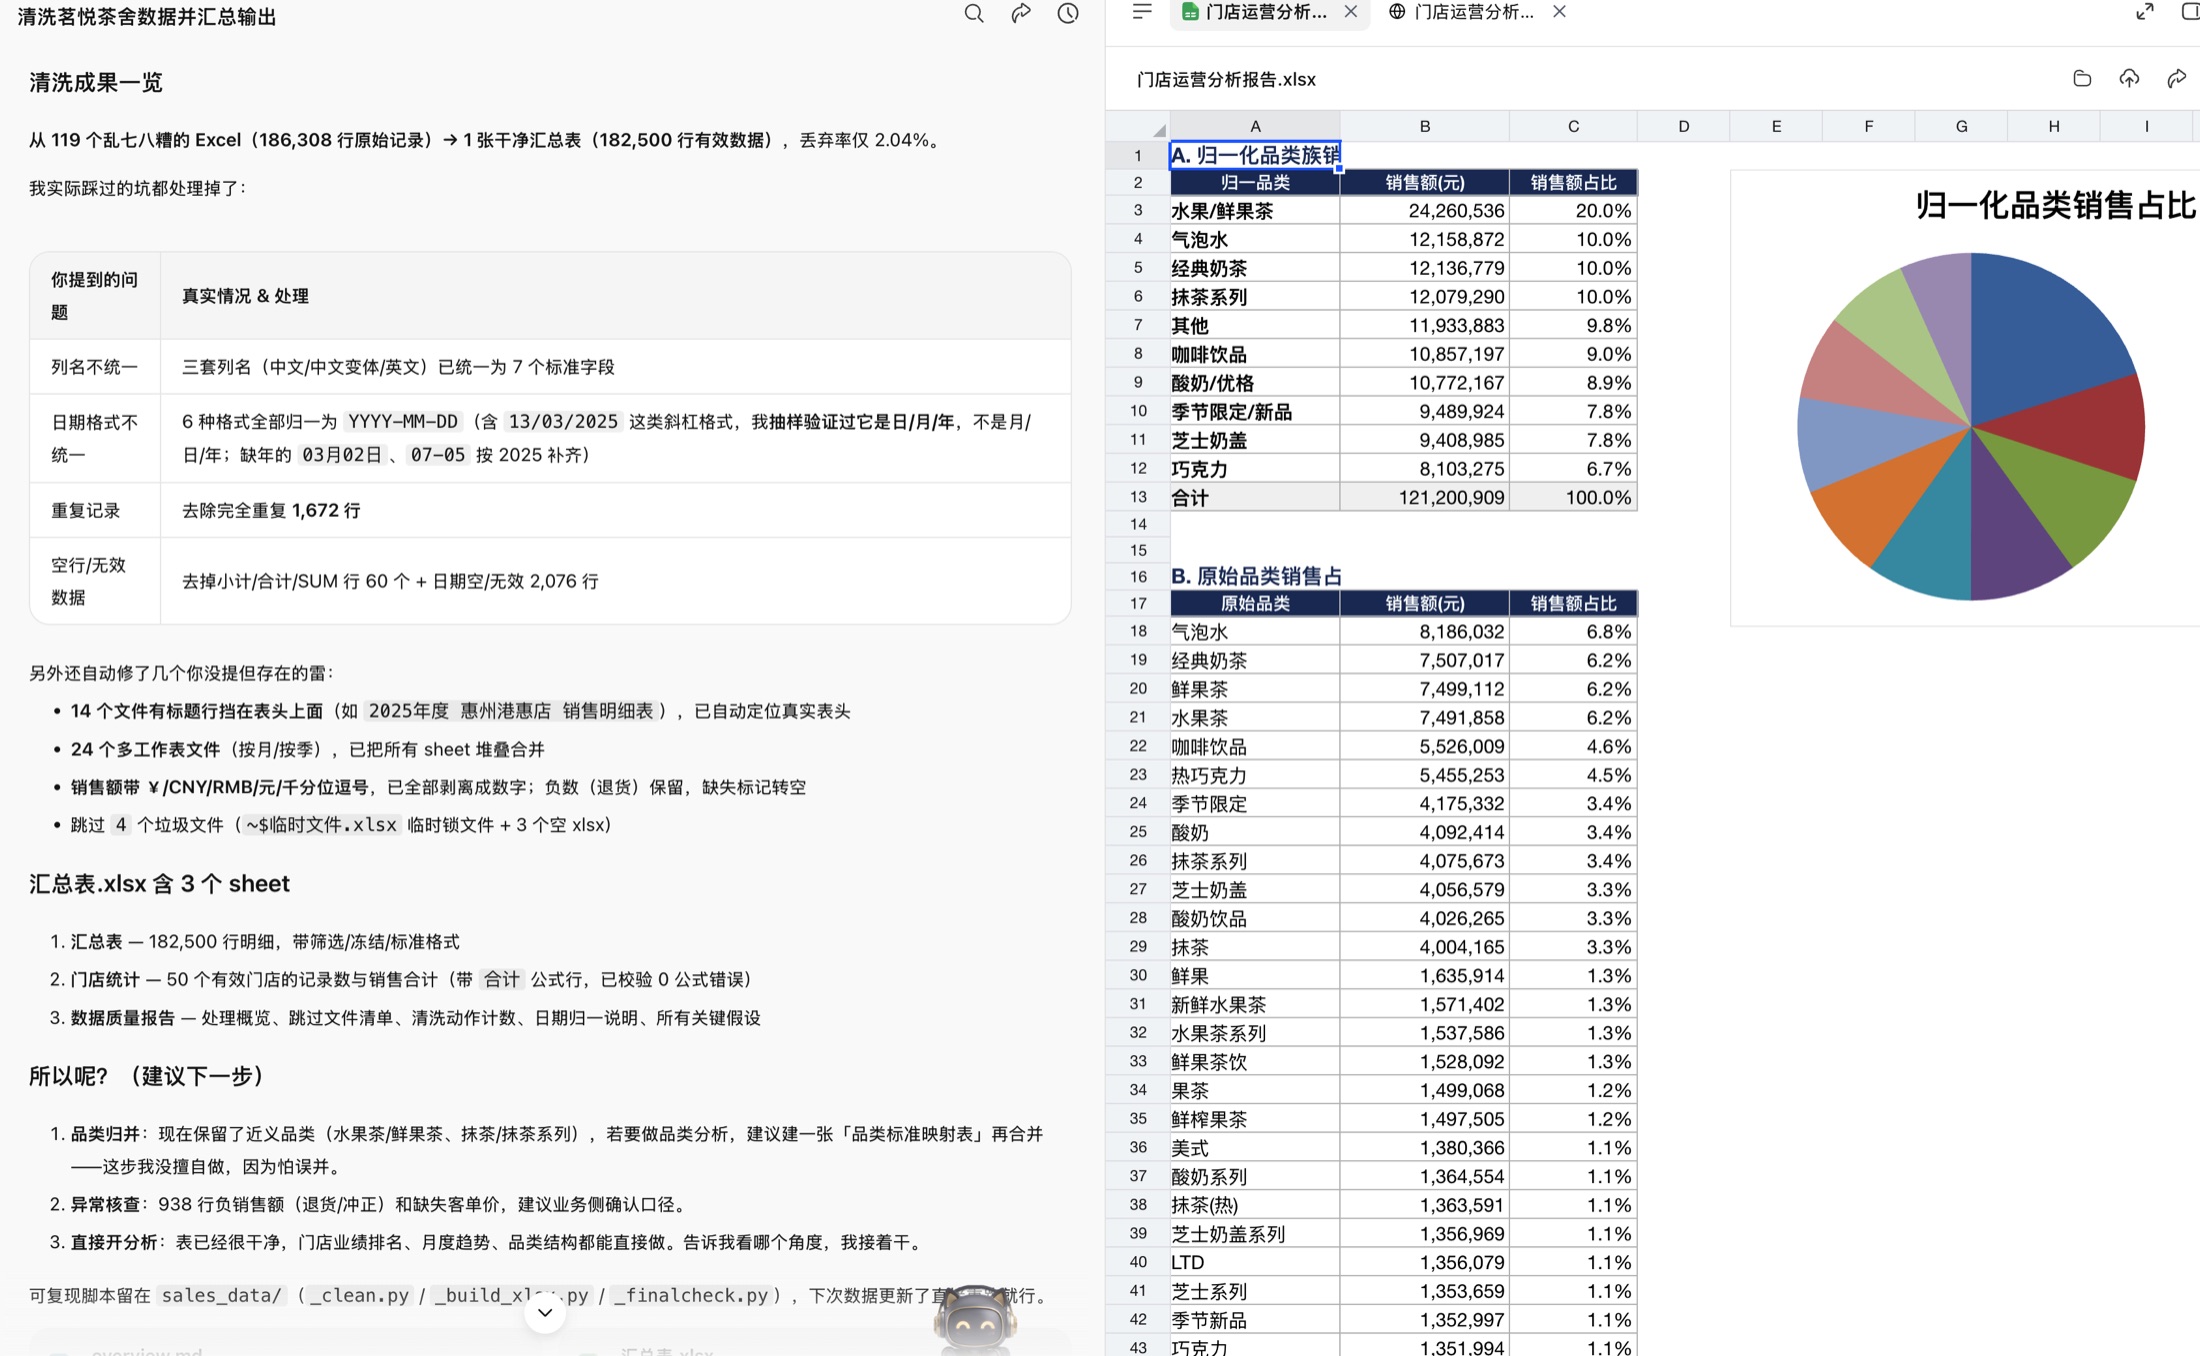
Cleaning result: original 186,308 rows → 182,500 valid (2.04% drop). Removed 60 subtotal/total rows, 2,076 invalid-date rows, 1,672 fully-duplicate records; 53 store names recognized (50 with valid data); same-name stores across files auto-merged. All definition assumptions written into the "Data Quality Report" sheet.
Excel analysis report: 8 sheets (cover metric cards / region summary / city summary / TOP10 stores / category share / monthly trend / insights & strategy suggestions / data notes & assumptions), 165 live formulas, recalc validated to 0 errors. Core findings: South China (28.8%) and East China (28.7%) as twin leaders together over half; TOP10 stores = 38.7% of total; fruit/fresh-fruit-tea category = 20.0%.
HTML cockpit: deep-green brand color + gold-accent consulting style; KPI cards, 5 charts and the store detail table all globally linked; the trend chart supports drag-to-select months. Aggregated numbers were multi-scenario-simulated and validated via a node script, fully consistent with the Excel report.
Execution: WorkBuddy starts executing after receiving the task instruction (left); after cleaning, it first reports what dirty-data problems it found and what handling assumptions it made, and continues after the human confirms definitions (right).

Acceptance Criteria
- The cleaned summary table's row count and store count reconcile with the source files (182,500 valid rows / 50 stores; drop detail traceable)
- The "Data Quality Report" sheet explicitly lists each handling assumption (year-missing dates default 2025, negative sales counted as net, etc.)
- The Excel report passes recalc: 0 formula errors
- The HTML dashboard's aggregated numbers (total, region, TOP store, category, monthly) match the Excel report one by one
- The dashboard file opens offline on double-click; linkage logic validated across multi-scenario simulation (single region / region+city / category / single month)
Issues Encountered
- Date-format ambiguity:
03/03/2025can't directly tell day/month/year from month/day/year. WorkBuddy confirmed day-first via sampling (e.g.15/03/2025in the same file) before batch parsing. - Year-missing dates:
03月02日records lack the year. WorkBuddy didn't guess; it proposed an assumption (all source files are 2025; default-fill 2025) and wrote it into the data-quality report for human confirmation. - Category synonyms: Are "fruit tea" and "fresh fruit tea" the same category? The cleaning stage only strips spaces and doesn't subjectively merge; the normalization rule is in the analysis stage, and the original 53 category details are fully preserved in the report for verification.
- Dashboard interaction pitfall: the first version's cross-filtering had a "after clicking only one bar left" problem — the clicked dimension itself got narrowed. Fixed by making the clicked-dimension chart ignore its own filter and always display fully with the selected item highlighted.
Safety and Limits
- This case uses teaching mock data (brand and stores are fictional) and is public; real business data must not be pasted verbatim into a public case — desensitize screenshots.
- The whole flow only reads/writes local directories; no external network, no account auth.
- WorkBuddy generates intermediate artifacts in the data directory (cleaning scripts, intermediate CSV, quality JSON); distinguish deliverables from process files before submitting or archiving.
- The cleaning script skips Excel temp-lock files (
~$prefix) and empty files; close any Excel you're editing before running.
How to Reuse
- Any multi-Excel merge scene: chain retail, distributor monthly reports, subsidiary reimbursements, questionnaire batch collection — wherever "multiple people each fill their own sheet, formats don't line up", the prompt框架 copies over.
- Recon before acting: step 1 requires WorkBuddy to scan and report problems before executing — a habit that applies to all data tasks and avoids silent definition-misguesses.
- Live-formula delivery: require analysis reports to use live formulas instead of hardcoded numbers; reports auto-update after later months' data is appended.
- Static report → interactive dashboard: first use the Excel report to confirm number definitions, then add one instruction to generate the HTML dashboard — a low-cost path to upgrade the reporting experience.